DOT - edges are not continuously smooth

Hi, all!
Although I read the entire DOT documentation and exhaustively searched the attributes (graph, node, and edge), I cannot figure out how to straighten the edges of my graph. I attach an example of how it should be and my graph. I needed to create the smaller black nodes to represent an element called binding. These bindings are connected to the activity nodes by invisible edges to force DOT drawing them near the activities. Maybe because of this the edges have an inflection at some of these points.
I would like to know which attributes would help me solve this. I have tried all types of values for splines. Also, I would like to know how to tell DOT that the bindings not connected by dashed lines should be closer to activity nodes than the ones connected by dashed lines.

All the best!


My code in python (a function):
def visualization(graph, act_total, activities, dep_dict, cnet_inbindings, cnet_outbindings):
“”"
Generate the visualization in GRAPHVIZ of C-nets for the given graph.

Args:
    graph (Graph): namedtuple("Graph", ["nodes", "edges", "is_directed"]) where nodes are activities and edges are dependencies based on thresholds.
    act_total (dictionary): dictionary representing the total frequency of activities in the log, where the key is the activity and the value is the frequency.
    activities (dictionary): nested dictionary presenting as outer key the activity, as inner key the activities that follow it with frequency as value.
    dep_dict (dictionary): nested dictionary representing the dependency measures between activities.
    cnet_inbindings (dictionary): nested dictionary with the input bindings (inner keys) for each activity (outer keys) based on its output_arcs and input_arcs of the dependency graph generated for the defined thresholds and replay of the traces.
    cnet_outbindings (dictionary): nested dictionary with the output bindings (inner keys) for each activity (outer keys) based on its output_arcs and input_arcs of the dependency graph generated for the defined thresholds and replay of the traces.
Returns:
    png file: png file containing the visualization of the C-nets model that represents the process.
"""

# ---- Create a dataframe of NODES with attributes, based on graph.nodes ----
nodes_df = pd.DataFrame({'node': [node for node in graph.nodes if node not in ['start', 'end']]})
nodes_df['label'] = nodes_df['node'].map(act_total).astype(str)
nodes_df['label'] = nodes_df['node'] + '\n' + nodes_df['label']
new_columns = {
    'type': 'activity',
    'source': 'NaN',
    'target': 'NaN',
    'binding': 'NaN',
    'len_binding': 'NaN',
    'color': '#97c2fc',
    'intensity': np.nan, 
    'shape': 'box',
    'size': 2,
    'obj_group': np.nan
}
nodes_df = nodes_df.assign(**new_columns)

# ---- Create a dataframe of EDGES with attributes, based on graph.edges ----
# First, filter out edges containing 'start' and 'end' activities
edges_filtered = [edge for edge in graph.edges if 'start' not in edge and 'end' not in edge]
# Then, it is needed to normalize the list of edges because they are tuples of two elements, but edges of long distance dependencies have a third element, the label
# After normalization, all edges (tuples) will have three elements, the third one will be NaN if not a long-distance dependency
col_len = 3
normalized_edges = [tuple((list(edge_tuple) + [None] * (col_len - len(edge_tuple)))) for edge_tuple in edges_filtered]

edges_df = pd.DataFrame(normalized_edges, columns=['source','target', 'long_distance_dep'])
# edges_df = edges_df.replace({None: np.nan})

# Create other columns for edges attributes
edges_df['frequency'] = edges_df.apply(lambda row: activities.get(row['source'], {}).get(row['target'], np.nan), axis=1).astype(str)
edges_df['dependency'] = edges_df.apply(lambda row: '{:.2f}'.format(round(dep_dict.get(row['source'], {}).get(row['target'], np.nan), 2)), axis=1)
edges_df['label'] = "freq = " + edges_df['frequency'] + ' / ' + "dep = " + edges_df['dependency']
edges_df['type'] = 'dependency'

# ---- Create OUTPUT BINDING NODES in the nodes_df dataframe based on the cnet_outbindings dictionary ----
# OUTPUT BINDING NODES are the nodes conected by dashed line to represent an AND connection
new_nodes = []

# Sequential number for nodes. This is used for the node name
seq = 1

# Iterate over the dictionary
for source, bindings in cnet_outbindings.items():
    # Iterate over each binding
    for binding, label in bindings.items():
        # Convert binding to string
        #binding_str = ' '.join(binding)
        
        # If binding has multiple elements, create separate rows for each element
        if len(binding) > 1:
            # Iterate over each element in the binding tuple
            for target in binding:
                # Append node information to the list
                new_nodes.append({
                    'node': f"o_{seq}", 
                    'label': None,
                    'type': 'outbinding',
                    'source': source,
                    'target': target,
                    'binding': binding,
                    'len_binding': len(binding),
                    'color': 'black',
                    'intensity': None,
                    'shape': 'point',
                    'size': 0.5,
                    'obj_group': None
                })

                seq += 1

        else:
            # These are SINGLE OUTPUT BINDINGS, not connected to other, they represent OR-relations
            # For single-element bindings, append only one row
            # Get the target from the binding tuple
            target = binding[0]
            # Append node information to the list
            new_nodes.append({
                'node': f"o_{seq}",
                'label': str(label),
                'type': 'outbinding',
                'source': source,
                'target': target,
                'binding': binding,
                'len_binding': len(binding),
                'color': 'black',
                'intensity': None,
                'shape': 'point',
                'size': 0.5,
                'obj_group': None
            })
            seq += 1       

# Create DataFrame from new_nodes, append it to the existing nodes dataframe and reorder columns in the final df
new_nodes_df = pd.DataFrame(new_nodes)
nodes_df = nodes_df._append(new_nodes_df, ignore_index=True)
nodes_df = nodes_df[['node','type','source','target','binding','len_binding','label','color','intensity','shape','size','obj_group']]


# ---- Create INPUT BINDING NODES in the nodes_df dataframe based on the inbindings dictionary ----
new_inbinding_nodes = []  # List to store new inbinding nodes

# Sequential number for nodes. This is used for the node name
seq = 1

# Iterate over the dictionary
for target, inbindings in cnet_inbindings.items():
    # Iterate over each inbinding
    for inbinding, label in inbindings.items():
        # Convert inbinding to string
        #inbinding_str = ' '.join(inbinding)

        
        # These are the input nodes that are composite (AND relation) and connected to other nodes with dashed line

        # If inbinding has multiple elements, create separate rows for each element
        if len(inbinding) > 1:
            # Iterate over each element in the inbinding tuple
            for source in inbinding:
                # Append node information to the list
                new_inbinding_nodes.append({
                    'node': f"i_{seq}", 
                    'type': 'inbinding',
                    'source': source,
                    'target': target,
                    'binding': inbinding,
                    'len_binding': len(inbinding),
                    'label': None,
                    'color': 'black',
                    'intensity': None,
                    'shape': 'dot',
                    'size': 0.5,
                    'obj_group': None
                })

                seq += 1

        else:
            # For single-element inbindings, append only one row
            # Get the target from the inbinding tuple
            source = inbinding[0]
            # Append node information to the list
            new_inbinding_nodes.append({
                'node': f"i_{seq}",
                'type': 'inbinding',
                'source': source,
                'target': target,
                'binding': inbinding,
                'len_binding': len(inbinding),
                'label': str(label),
                'color': 'black',
                'intensity': None,
                'shape': 'dot',
                'size': 0.5,
                'obj_group': None
            })
            seq += 1       

# Create DataFrame from new_inbinding_nodes and append it to the existing nodes dataframe
new_inbinding_nodes_df = pd.DataFrame(new_inbinding_nodes)
nodes_df = nodes_df._append(new_inbinding_nodes_df, ignore_index=True)


# ---- Create VISUALIZATION EDGES to connect nodes and dots ----

# First, create the dataframe of edges to be represented visually
# Column 'object_relation' is to be used in object-centric and shows if it is intrabinding (between activities of the same object) or interbinding (between activities of different objects)
vis_edges = pd.DataFrame(columns=['original_edge', 'source', 'target', 'label', 'type', 'color', 'intensity', 'width', 'object_relation', 'arrow']) 

# Iterate over rows of nodes_df to populate the visualization dataframe
# Filter intermediary nodes
intermediary_nodes = nodes_df[(nodes_df['node'].str.startswith('o_') | nodes_df['node'].str.startswith('i_'))]

# Group intermediary nodes by source and target
intermediary_nodes_grouped = intermediary_nodes.groupby(['source', 'target'])

# Initialize list to store edges data
edges_data = []

# Iterate over each group
for (source, target), group in intermediary_nodes_grouped:
    # Extract intermediary nodes
    o_nodes = group[group['node'].str.startswith('o_')].sort_values(by='len_binding')
    i_nodes = group[group['node'].str.startswith('i_')].sort_values(by='len_binding', ascending=False)
    
    # Create edges between source and o_nodes
    edges_data.append({'original_edge': f"{source} {target}", 'source': source, 'target': o_nodes.iloc[0]['node'], 'label': '', 'type': 'visualization', 'color': 'black', 'intensity': None, 'width': None, 'length': 1, 'object_relation': None, 'arrow': False})
    for i in range(len(o_nodes) - 1):
        edges_data.append({'original_edge': f"{source} {target}", 'source': o_nodes.iloc[i]['node'], 'target': o_nodes.iloc[i+1]['node'], 'label': '', 'type': 'visualization', 'color': 'black', 'intensity': None, 'width': None, 'length': 1, 'object_relation': None, 'arrow': False})
    
    # Create edges between last o_node and first i_node
    label_edge = f"{activities[source][target]} / {dep_dict[source][target]:.2f}"
    edges_data.append({'original_edge': f"{source} {target}", 'source': o_nodes.iloc[-1]['node'], 'target': i_nodes.iloc[0]['node'], 'label':label_edge, 'type': 'visualization', 'color': 'black', 'intensity': None, 'width': None, 'length': 4, 'object_relation': None, 'arrow': False})
    
    # Create edges between i_nodes
    for i in range(len(i_nodes) - 1):
        edges_data.append({'original_edge': f"{source} {target}", 'source': i_nodes.iloc[i]['node'], 'target': i_nodes.iloc[i+1]['node'], 'label': '', 'type': 'visualization', 'color': 'black', 'intensity': None, 'width': None, 'length': 1, 'object_relation': None, 'arrow': False})
    
    # Create edge from last i_node to target
    edges_data.append({'original_edge': f"{source} {target}", 'source': i_nodes.iloc[-1]['node'], 'target': target, 'label': '', 'type': 'visualization', 'color': 'black', 'intensity': None, 'width': None, 'length': 1, 'object_relation': None, 'arrow': True})


# Populate pyvis_edges DataFrame with edges data
vis_edges = pd.DataFrame(edges_data)


# ---- Create EDGES TO CONNECT THE BINDINGS with len > 1 ----
additional_edges = []

nodes_df['len_binding'] = pd.to_numeric(nodes_df['len_binding'], errors='coerce')

# Filter nodes_df to consider only rows with len_binding > 1
filtered_nodes_df = nodes_df[nodes_df['len_binding'] > 1]


# OUTPUT bindings

# Group nodes_df by 'source', 'binding', and 'len_binding' for nodes beginning with 'o_'
grouped_o_nodes = filtered_nodes_df[filtered_nodes_df['node'].str.startswith('o_')].groupby(['source', 'binding', 'len_binding'])

# Iterate over groups
for group_key, group in grouped_o_nodes:
    source, binding, len_binding = group_key
    if group.shape[0] > 1:
        # Extract combinations of nodes to create edges
        o_nodes_comb = list(combinations(group['node'], 2))
        # Iterate over combinations
        for node1, node2 in o_nodes_comb:
            binding_tuple = binding
            # Lookup label in the dictionary
            label = cnet_outbindings.get(source, {}).get(binding_tuple, None)
            if label is not None:
                # Add edge data
                additional_edges.append({
                    'original_edge': None,
                    'source': node1,
                    'target': node2,
                    'label': label,
                    'type': 'vis_binding',
                    'color': 'black',
                    'intensity': None,
                    'width': None,
                    'object_relation': None
                })

# INPUT bindings

# Group nodes_df by 'target', 'binding', and 'len_binding' for nodes beginning with 'i_'
grouped_i_nodes = filtered_nodes_df[filtered_nodes_df['node'].str.startswith('i_')].groupby(['target', 'binding', 'len_binding'])

# Iterate over groups
for (target, binding, len_binding), group in grouped_i_nodes:
    if group.shape[0] > 1:
        # Extract combinations of nodes to create edges
        i_nodes_comb = list(combinations(group['node'], 2))
        # Iterate over combinations
        for node1, node2 in i_nodes_comb:
            binding_tuple = binding
            # Lookup label in the dictionary
            label = cnet_inbindings.get(target, {}).get(binding_tuple, None)
            if label is not None:
                # Add edge data
                additional_edges.append({
                    'original_edge': None,
                    'source': node1,
                    'target': node2,
                    'label': label,
                    'type': 'vis_binding',
                    'color': 'black',
                    'intensity': None,
                    'width': None,
                    'object_relation': None
                })

# Create DataFrame with additional edges
additional_vis_edges = pd.DataFrame(additional_edges)

# Create Dataframe with long_dstance_dependency edges
ldd = []

for index, row in edges_df.iterrows():
    if row['long_distance_dep'] != None:
        ldd.append({
                    'original_edge': None,
                    'source': row['source'],
                    'target': row['target'],
                    'label': "",
                    'type': 'ldd_visualization',
                    'color': 'red',
                    'intensity': None,
                    'width': None,
                    'object_relation': None,
                    'arrow': True
                })

ldd_edges = pd.DataFrame(ldd)

# Concatenate the original pyvis_edges DataFrame with additional_pyvis_edges
vis_edges = pd.concat([vis_edges, additional_vis_edges, ldd_edges], ignore_index=True)


# ---- VISUALIZATION IN GRAPHVIZ ----

graph = graphviz.Digraph(format='png')
# Set margins to the drawing
graph.attr(nodesep='0.3', ranksep='.3', pad='1', splines='splines')

# Add nodes
for index, row in nodes_df.iterrows():
    shape = 'point' if row['shape'] == 'dot' else row['shape']
    width = str(row['size']) if row['type'] == 'activity' else '0.09in'
    height = 'default' if row['type'] == 'activity' else '0.09in'

    label = row['label'] if row['label'] != None else None
    if row['type'] != 'activity':
        graph.node(row['node'], xlabel=label, color=row['color'], shape=shape, width=width, height=height, style='filled')
    else:
        graph.node(row['node'], label=label, color='powderblue', shape=shape, width=width, height=height, style='rounded,filled')


# Add INVISIBLE EDGES to enforce outbinding and inbinding nodes near activity nodes

# Sort nodes by len_binding in ascending order for outbinding nodes and descending order for inbinding nodes
sorted_nodes_df = nodes_df.sort_values(by=['type', 'source', 'target', 'binding', 'len_binding'], ascending=[True, True, True, True, False])

# Add invisible edges to enforce relative positioning for outbinding and inbinding nodes
for index, row in sorted_nodes_df.iterrows():
    if row['type'] == 'outbinding':
        activity_node = sorted_nodes_df[(sorted_nodes_df['type'] == 'activity') & (sorted_nodes_df['node'] == row['source'])]
        if not activity_node.empty:
            graph.edge(row['source'], row['node'], style='invisible', arrowhead='none')
    elif row['type'] == 'inbinding':
        activity_node = sorted_nodes_df[(sorted_nodes_df['type'] == 'activity') & (sorted_nodes_df['node'] == row['target'])]
        if not activity_node.empty:
            graph.edge(row['node'], row['target'], style='invisible', arrowhead='none')


# Add edges
for index, row in vis_edges.iterrows():
    length_str = str(row['length'])
    if row['type'] == 'vis_binding':
        graph.edge(row['source'], row['target'], label=str(row['label']), color=row['color'], style='dashed', penwidth=str(row['width']), arrowhead='none')
    elif row['arrow']:
        # Add arrowhead to the edge that points to the target node
        graph.edge(row['source'], row['target'], label=str(row['label']), color=row['color'], penwidth=str(row['width']), minlen=length_str, arrowhead='vee', dir='forward')
    elif row['type'] == 'ldd_visualization':
        graph.edge(row['source'], row['target'], color=row['color'], style='dotted', penwidth=str(row['width']), arrowhead=row['arrow'])
    else:
        graph.edge(row['source'], row['target'], label=str(row['label']), color=row['color'], penwidth=str(row['width']), minlen=length_str, arrowhead='none', labeldistance='10')


# Render the graph
graph.render('graphviz_cnet', format='png', cleanup=True)

# Display the graph
graph.view()

Please also provide the output in dot format (format=‘dot’).

This would be trivial to implement using arrowheads (Arrow Shapes | Graphviz), except for:

  • more than 2 “bindings” with labels on an edge
  • Graphviz does not directly support edges connecting edges (the dashed lines)

Pretty sure your goal is attainable, but it will require more than just arrowheads

Thank you for the reply!

I attached the dot file. I renamed it to .txt because of MS Word.
Please note that the dashed lines are connecting nodes, the small black ones.
graphviz_cnet.txt (23.6 KB)

An additional information: my code generates a graph for an object type, as shown in the picture, but now I will try to merge all graphs in one. I wonder if each object type should be a subgraph or if subgraphs are more suited to group nodes only.

  1. should the dashed lines be (roughly) horizontal?
  2. why are there semi-duplicate edges from an activity node to a binding (e.g. i_19 → “failed delivery”), with one being invisible?
  1. I would like them to be slightly curved but Graphviz plots them straight, the angle may vary it is not always horizontal because it depends on the black nodes positions and this is ok
  2. I created the invisible edges because the black nodes were far from the activities they are related to, so the solution I found was to create invisible edges to ‘anchor’ the black nodes. As nodes and edges are generated by for loops, I did not know how to determine the relative position. Also, I am very new to Graphviz and I have a deadline to finish this, so I think I will not have time to dig into the dot language as I should

What is really bad is to have these edges like broken. Sometimes they flow well but other parts are really bad

Closer?

Absolutely! Great, much better. Is it possible to force the black nodes nearer the activities? I do not know why but the i_ nodes are ok but the o_ nodes are usually so far way. They should be near the next activity the edge is leading to. I suspect this also messed with the edges and it influences the dashed lines too. An example: from place order to pick item. The last black node should be near pick item
Correction: the o_ nodes are usually ok, but the i_ nodes are positioned far away from the next activity the edge is pointing to

In reality, the black nodes should always be near the activity nodes, as in the example, where the bindings are blue, corresponding to my black nodes

There is no easy way to specify that two connected nodes be “ranked” close to each other. TBbalance attribute comes close, but “no cigar”. Makes sense, but not today.

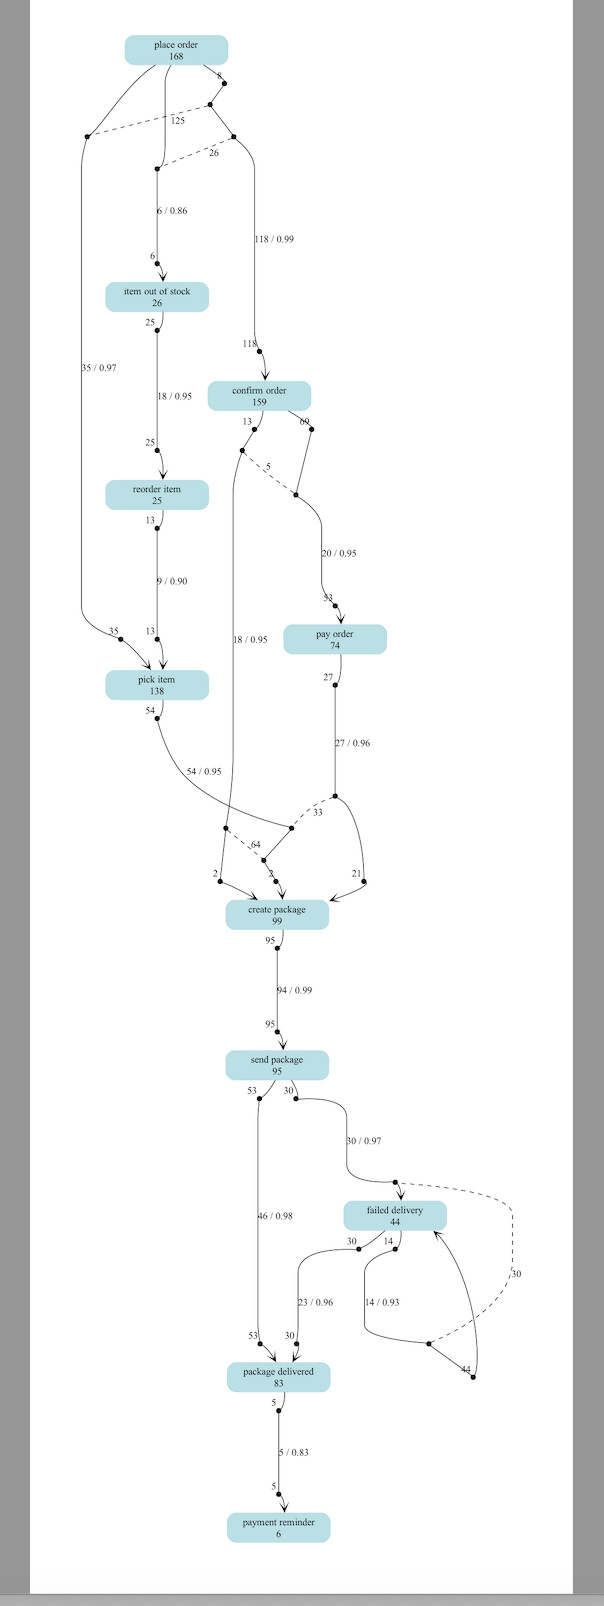
Here is a pipeline that does what you ask:

  1. run your Python prog, modified to produce an output similar to the file shown below, but create dot output
  2. run this command: dot -Gphase=3 myfile.dot -o myNewFile.dot Ignore error/warnings about no position for edge (seemingly a bug in dot)
  3. then gvpr -aD -cf makeClose.gvpr myNewFile.dot | dot -Tpng ...

makeClose.gvpr:


BEG_G{
  int doubleRanks;
  int i=0;
  int delta;
  string help="no help, yet";
  
  doubleRanks=0;
  while (i<ARGC) {
    if (ARGV[i]=="D") {
      doubleRanks=1;
      print("// halving rank distance");
    }else{
      printf(2, help);
      exit (1);
    }
    i++;
  }
  $G.phase="";
}
E[makeclose=="1"]{
  edge_t anEdge;
  node_t tailtailNode;
  anEdge=fstin($.tail);
  tailtailNode=anEdge.tail;
  print("//  edge: ", $,name, "    ",tailtailNode.name);
  delta=(int)$.head.rank - (int)tailtailNode.rank;
  print("//  delta: ",delta);
  if (doubleRanks){
    delta=delta/2;
  }
  delta--;
  print("//  delta: ",delta);
  anEdge.minlen=delta;
  print ("// minlen: ", anEdge.minlen, "  ", $.head.rank, "  ",tailtailNode.rank);
}

Finally, the modified version of your file (I removed attributes that were not needed, added group=same a few places, and created a new attribute makeclose):

digraph {
	graph [bb="0,0,615.5,2108",
//		nodesep=0.3,
//		pad=1,
//		ranksep=.3,
		splines=true
		//splines=polyline
		TBbalance=min
	];
	node [label="\N"];
	"place order"	[color=powderblue,
		height=0.56944,
		label="place order
168",
		shape=box,
		style="rounded,filled",
		width=2];
	o_2	[color=black,
		height=0.09,
		shape=point,
		style=filled,
		width=0.09];
	"place order" -> o_2	[arrowhead=none,
		color=black,
		labeldistance=10,
		];
	o_4	[color=black,
		height=0.09,
		shape=point,
		style=filled,
		width=0.09];
	"place order" -> o_4	[arrowhead=none,
		color=black,
		labeldistance=10,
		];
	o_5	[color=black,
		height=0.09,
		shape=point,
		style=filled,
		width=0.09,
		xlabel=8,
		xlp="193.38,2052.3"];
	"place order" -> o_5	[arrowhead=none,
		color=black,
		labeldistance=10,
		];
	o_1	[color=black,
		height=0.09,
		shape=point,
		style=filled,
		width=0.09];
  {rank=same o_1  o_2 }
	o_1 -> o_2	[arrowhead=none,
		color=black,
		label=125,
		lp="135.12,1988.8",
		style=dashed];
	o_3	[color=black,
		height=0.09,
		shape=point,
		style=filled,
		width=0.09];
	o_1 -> o_3	[arrowhead=none,
		color=black,
		labeldistance=10,
		];
	i_1	[color=black,
		height=0.09,
		shape=point,
		style=filled,
		width=0.09,
		xlabel=35,
		xlp="45.01,1274.7"];
	o_2 -> i_1	[arrowhead=none,
		color=black,
		label="35 / 0.97",
		labeldistance=10,
		lp="24.375,1643.4",
		];
		{rank=same 	o_3 o_4}
	o_3 -> o_4	[arrowhead=none,
		color=black,
		label=26,
		lp="185.75,1943.8",
		style=dashed];
	i_3	[color=black,
		height=0.09,
		shape=point,
		style=filled,
		width=0.09,
		xlabel=118,
		xlp="235.63,1677.4"];
	o_3 -> i_3	[arrowhead=none,
		color=black,
		label="118 / 0.99",
		labeldistance=10,
		lp="269.75,1823.4",
		];
	i_15	[color=black,
		height=0.09,
		shape=point,
		style=filled,
		width=0.09,
		xlabel=6,
		xlp="99.385,1800.4"];
	o_4 -> i_15	[arrowhead=none,
		color=black,
		label="6 / 0.86",
		labeldistance=10,
		lp="127,1862.9",
		];
	o_5 -> o_1	[arrowhead=none,
		color=black,
		labeldistance=10,
		];
	"pick item"	[color=powderblue,
		height=0.56944,
		label="pick item
138",
		shape=box,
		style="rounded,filled",
		width=2];
	o_6	[color=black,
		height=0.09,
		shape=point,
		style=filled,
		width=0.09,
		xlabel=54,
		xlp="96.01,1164"];
	"pick item" -> o_6	[arrowhead=none,
		color=black,
		labeldistance=10,
		];
	i_6	[color=black,
		height=0.09,
		shape=point,
		style=filled,
		width=0.09];
	o_6 -> i_6	[arrowhead=none,
		color=black,
		label="54 / 0.95",
		labeldistance=10,
		lp="171.38,1078.5",
		];
	"confirm order"	[color=powderblue,
		height=0.56944,
		label="confirm order
159",
		shape=box,
		style="rounded,filled",
		width=2];
	o_7	[color=black,
		height=0.09,
		shape=point,
		style=filled,
		width=0.09,
		xlabel=69,
		xlp="312.01,1568.4"];
	"confirm order" -> o_7	[arrowhead=none,
		color=black,
		labeldistance=10,
		];
	o_8	[color=black,
		height=0.09,
		shape=point,
		style=filled,
		width=0.09,
		xlabel=13,
		xlp="232.01,1568.4"];
	"confirm order" -> o_8	[arrowhead=none,
		color=black,
		labeldistance=10,
		];
	o_10	[color=black,
		height=0.09,
		shape=point,
		style=filled,
		width=0.09];
	o_7 -> o_10	[arrowhead=none,
		color=black,
		labeldistance=10,
		];
	o_9	[color=black,
		height=0.09,
		shape=point,
		style=filled,
		width=0.09];
	o_8 -> o_9	[arrowhead=none,
		color=black,
		labeldistance=10,
		];
{rank=same o_9  o_10 }
	o_9 -> o_10	[arrowhead=none,
		color=black,
		label=5,
		lp="261.38,1505",
		style=dashed];
	i_7	[color=black,
		height=0.09,
		shape=point,
		style=filled,
		width=0.09];
	o_9 -> i_7	[arrowhead=none,
		color=black,
		label="18 / 0.95",
		labeldistance=10,
		lp="236.38,1263.2",
		];
	i_4	[color=black,
		height=0.09,
		shape=point,
		style=filled,
		width=0.09,
		xlabel=53,
		xlp="345.01,1321.5"];
	o_10 -> i_4	[arrowhead=none,
		color=black,
		label="20 / 0.95",
		labeldistance=10,
		lp="360.38,1384",
		];
	"pay order"	[color=powderblue,
		height=0.56944,
		label="pay order
74",
		shape=box,
		style="rounded,filled",
		width=2];
	o_11	[color=black,
		height=0.09,
		shape=point,
		style=filled,
		width=0.09,
		xlabel=27,
		xlp="345.01,1210.7"];
	"pay order" -> o_11	[arrowhead=none,
		color=black,
		labeldistance=10,
		];
	i_5	[color=black,
		height=0.09,
		shape=point,
		style=filled,
		width=0.09];
	o_11 -> i_5	[arrowhead=none,
		color=black,
		label="27 / 0.96",
		labeldistance=10,
		lp="379.38,1118",
		];
	"create package"	[color=powderblue,
		height=0.56944,
		label="create package
99",
		shape=box,
		style="rounded,filled",
		width=2];
	o_12	[color=black,
		height=0.09,
		shape=point,
		style=filled,
		width=0.09,
		xlabel=95,
		xlp="264.01,842.59"];
	"create package" -> o_12	[arrowhead=none,
		color=black,
		labeldistance=10,
		];
	i_12	[color=black,
		height=0.09,
		shape=point,
		style=filled,
		width=0.09,
		xlabel=95,
		xlp="264.01,725.61"];
	o_12 -> i_12	[arrowhead=none,
		color=black,
		label="94 / 0.99",
		labeldistance=10,
		lp="298.38,772.61",
		];
	"send package"	[color=powderblue,
		height=0.56944,
		label="send package
95",
		shape=box,
		style="rounded,filled",
		width=2];
	o_13	[color=black,
		height=0.09,
		shape=point,
		style=filled,
		width=0.09,
		xlabel=53,
		xlp="239.01,632.13"];
	"send package" -> o_13	[arrowhead=none,
		color=black,
		labeldistance=10,
		];
	o_14	[color=black,
		height=0.09,
		shape=point,
		style=filled,
		width=0.09,
		xlabel=30,
		xlp="290.01,632.13"];
	"send package" -> o_14	[arrowhead=none,
		color=black,
		labeldistance=10,
		];
	i_13	[color=black,
		height=0.09,
		shape=point,
		style=filled,
		width=0.09,
		xlabel=53,
		xlp="240.01,289.19"];
	o_13 -> i_13	[arrowhead=none,
		color=black,
		label="46 / 0.98",
		labeldistance=10,
		lp="271.38,456.92",
		];
	i_19	[color=black,
		height=0.09,
		shape=point,
		style=filled,
		width=0.09];
	o_14 -> i_19	[arrowhead=none,
		color=black,
		label="30 / 0.97",
		labeldistance=10,
		lp="395.38,562.15",
		];
	"package delivered"	[color=powderblue,
		height=0.56944,
		label="package delivered
83",
		shape=box,
		style="rounded,filled",
		width=2];
	o_15	[color=black,
		height=0.09,
		shape=point,
		style=filled,
		width=0.09,
		xlabel=5,
		xlp="269.38,195.71"];
	"package delivered" -> o_15	[arrowhead=none,
		color=black,
		labeldistance=10,
		];
	i_17	[color=black,
		height=0.09,
		shape=point,
		style=filled,
		width=0.09,
		xlabel=5,
		xlp="269.38,78.73"];
	o_15 -> i_17	[arrowhead=none,
		color=black,
		label="5 / 0.83",
		labeldistance=10,
		lp="297,125.73",
		];
	"item out of stock"	[color=powderblue,
		height=0.56944,
		label="item out of stock
26",
		shape=box,
		style="rounded,filled",
		width=2];
	o_16	[color=black,
		height=0.09,
		shape=point,
		style=filled,
		width=0.09,
		xlabel=25,
		xlp="96.01,1706.9"];
	"item out of stock" -> o_16	[arrowhead=none,
		color=black,
		labeldistance=10,
		];
	i_16	[color=black,
		height=0.09,
		shape=point,
		style=filled,
		width=0.09,
		xlabel=25,
		xlp="96.01,1538.9"];
	o_16 -> i_16	[arrowhead=none,
		color=black,
		label="18 / 0.95",
		labeldistance=10,
		lp="130.38,1603.7",
		];
	"reorder item"	[color=powderblue,
		height=0.56944,
		label="reorder item
25",
		shape=box,
		style="rounded,filled",
		width=2];
	o_17	[color=black,
		height=0.09,
		shape=point,
		style=filled,
		width=0.09,
		xlabel=13,
		xlp="96.01,1430"];
	"reorder item" -> o_17	[arrowhead=none,
		color=black,
		labeldistance=10,
		];
	i_2	[color=black,
		height=0.09,
		shape=point,
		style=filled,
		width=0.09,
		xlabel=13,
		xlp="96.01,1274.7"];
	o_17 -> i_2	[arrowhead=none,
		color=black,
		label="9 / 0.90",
		labeldistance=10,
		lp="127,1344.5",
		];
	"payment reminder"	[color=powderblue,
		height=0.56944,
		label="payment reminder
6",
		shape=box,
		style="rounded,filled",
		width=2];
	"failed delivery"	[color=powderblue,
		height=0.56944,
		label="failed delivery
44",
		shape=box,
		style="rounded,filled",
		width=2];
	o_18	[color=black,
		height=0.09,
		shape=point,
		style=filled,
		width=0.09,
		xlabel=30,
		xlp="378.01,421.67"];
	"failed delivery" -> o_18	[arrowhead=none,
		color=black,
		labeldistance=10,
		];
	o_19	[color=black,
		height=0.09,
		shape=point,
		style=filled,
		width=0.09,
		xlabel=14,
		xlp="429.01,421.67"];
	"failed delivery" -> o_19	[arrowhead=none,
		color=black,
		labeldistance=10,
		];
	i_14	[color=black,
		height=0.09,
		shape=point,
		style=filled,
		width=0.09,
		xlabel=30,
		xlp="291.01,289.19"];
	o_18 -> i_14	[arrowhead=none,
		color=black,
		label="23 / 0.96",
		labeldistance=10,
		lp="327.38,336.19",
		];
	i_18	[color=black,
		height=0.09,
		shape=point,
		style=filled,
		width=0.09];
	o_19 -> i_18	[arrowhead=none,
		color=black,
		label="14 / 0.93",
		labeldistance=10,
		lp="420.38,336.19",
		];
	i_1 -> "pick item"	[arrowhead=vee,
          makeclose=1
		color=black,
		dir=forward,
		];
	i_3 -> "confirm order"	[arrowhead=vee,
          makeclose=1
		color=black,
		dir=forward,
		];
	i_15 -> "item out of stock"	[arrowhead=vee,
		color=black,
		dir=forward,
		];
	i_8	[color=black,
		height=0.09,
		shape=point,
		style=filled,
		width=0.09];
	i_6 -> i_8	[arrowhead=none,
		color=black,
		labeldistance=10,
		];
{rank=same i_7  i_8}
	i_7 -> i_8	[arrowhead=none,
		color=black,
		label=64,
		lp="243.75,976.55",
		style=dashed];
	i_10	[color=black,
		height=0.09,
		shape=point,
		style=filled,
		width=0.09,
		xlabel=2,
		xlp="187.38,936.07"];
	i_7 -> i_10	[arrowhead=none,
		color=black,
		labeldistance=10,
		];
	i_4 -> "pay order"	[arrowhead=vee,
		color=black,
		dir=forward,
		];
{rank=same 	i_5  i_6}
	i_5 -> i_6	[arrowhead=none,
		color=black,
		label=33,
		lp="330.75,1021.5",
		style=dashed];
	i_9	[color=black,
		height=0.09,
		shape=point,
		style=filled,
		width=0.09,
		xlabel=21,
		xlp="385.01,936.07"];
	i_5 -> i_9	[arrowhead=none,
		color=black,
		labeldistance=10,
		];
	i_12 -> "send package"	[arrowhead=vee,
		color=black,
		dir=forward,
		];
	i_13 -> "package delivered"	[arrowhead=vee,
          makeclose=1
		color=black,
		dir=forward,
		];
	i_19 -> "failed delivery"	[arrowhead=vee,
		color=black,
		dir=forward,
		];
	i_17 -> "payment reminder"	[arrowhead=vee,
		color=black,
		dir=forward,
		];
	i_16 -> "reorder item"	[arrowhead=vee,
		color=black,
		dir=forward,
		];
	i_2 -> "pick item"	[arrowhead=vee,
		color=black,
		dir=forward,
		];
	i_14 -> "package delivered"	[arrowhead=vee,
          makeclose=1
		color=black,
		dir=forward,
		];
{rank=same i_18  i_19 }
	i_18 -> i_19	[arrowhead=none,
		color=black,
		label=30,
		lp="608.75,375.69",
		style=dashed];
	i_20	[color=black,
		height=0.09,
		shape=point,
		style=filled,
		width=0.09,
		xlabel=44,
		xlp="538.01,242.45"];
	i_18 -> i_20	[arrowhead=none,
		color=black,
		labeldistance=10,
		];
	i_9 -> "create package"	[arrowhead=vee,
		color=black,
		dir=forward,
		];
	i_11	[color=black,
		height=0.09,
		shape=point,
		style=filled,
		width=0.09,
		xlabel=2,
		xlp="265.38,936.07"];
	i_8 -> i_11	[arrowhead=none,
		color=black,
		labeldistance=10,
		];
	i_10 -> "create package"	[arrowhead=vee,
		color=black,
		dir=forward,
		];
	i_11 -> "create package"	[arrowhead=vee,
		color=black,
		dir=forward,
		];
	i_20 -> "failed delivery"	[arrowhead=vee,
		color=black,
		dir=forward,
		];
}

Thank you very much, @steveroush!
As I said, I am still learning Python and Graphviz. Since this code is to be applied to different source files to produce the graph, I will try the approach you offered, making the adjustments and come back if I cannot understand sth. Great job, thanks once more!

Hi, @steveroush ! I am stuck on the first step of your instructions, beginning with “BEG_G {”
As you can see in my python code, I only create the graph, but I do not use the {} notation to populate the graph, instead I use my code in python applying the with subgraph-statement. So, I don’t know how to implement this first step. I could insert the attributes in parentheses but I see that there is a while-loop. Not sure how to do this.

I was not clear.

  1. The file that starts BEG_G is a gvpr program (see https://www.graphviz.org/pdf/gvpr.1.pdf). gvpr has its own programming language, designed to support working with graphs. Save that file as “makeClose.gvpr” and for the time being, trust me. “makeClose.gvpr” will try to force specific edges to be shorter.
  2. Modify your Python program to produce output similar to the 2nd file above that starts digraph. However, ignore the bb* and xlp attributes.

Thanks! I think that you were clear, but I am very new in this :slight_smile: , so I did not know about this language gvpr. I will give it a try

Hi @steveroush ! I have done steps 1 and 2, but regarding step 3: then gvpr -aD -cf makeClose.gvpr myNewFile.dot | dot -Tpng ...

I got this error: gvpr: Could not find file “makeClose.gvpr” in GVPRPATH

Another question, when you say: ’ and created a new attribute makeclose’, does it mean that I have to create this attribute in my python code? Or does the execution of makeClose.gpvr create it? I created it in my python code as an attribute to some edges.

Now that I am experimenting with more than one object type (to), I see that one object type influences the other. The example I gave you has only one to. So, maybe the makeClose functionality will not be enough. Here, some pictures with more than one ot, each one has a different color. I have examples with two or more. Note that now the bindings are aligned because I created the groups as you suggested. But one to interferes with the other.
I don’t want to bother you further, I only would like some advice on the best approach to produce a more organised graph: layers? clusters (each ot is already a cluster)? subgraphs? Which way could I go?
Thank you!

graphviz_cnet_2.pdf (41.2 KB)
graphviz_cnet_4.dot (35.7 KB)
graphviz_cnet_4.pdf (38.2 KB)
graphviz_cnet_2.dot (53.8 KB)

  • The gvpr step should work if “makeClose.gvpr” is in the same directory (folder) as “myNewFile.dot” (or whatever you named the output of the 1st dot cmd)
  • Yes, your Python program needs to add the makeclose attributes to the edges. Then the gvpr program will compute rank differences and add minlen attributes as needed.

an “organised graph” is in the eye of the beholder.
I agree that I am not thrilled by the current results, but I can only guess at what you dislike the most and what is OK. But here goes:

  • The (blue) node placement seems fine
  • The edge placement seems quite messy & out of control.

Duh.

I guess my next step would be :
for every edge that

  • contains only 2(ish?) point nodes (bindings?)
  • is not connected to another binding (dashed line)

When possible, replace the point nodes with arrowheads & taillabels/headlabels (see below)

Unfortunately, this does not apply to all edges, leaving some with the point nodes - more complex programming. But the edges should look much smoother.

digraph A{
  ranksep=1.6
  edge[dir=both]
  // maximum of 4 arrowheads concatenated
  a->b [arrowsize=1.2 arrowhead=nonenonedot  arrowtail=nonedotnonedot
        headlabel="dog " taillabel="hot\nhotter   " label=123]
  c->d [arrowhead=dotnonenonedot arrowtail=nonenonedotdot
      headlabel="in\nout  " taillabel="look\nup" label="ab"]
  a->c [arrowhead=dotnonenonedot
       taillabel="  stand"  headlabel="  still "  label="1 more"]
}

Giving:

Very nice, I did not know arrowheads could be an option here. I will give it a try. Thank you!