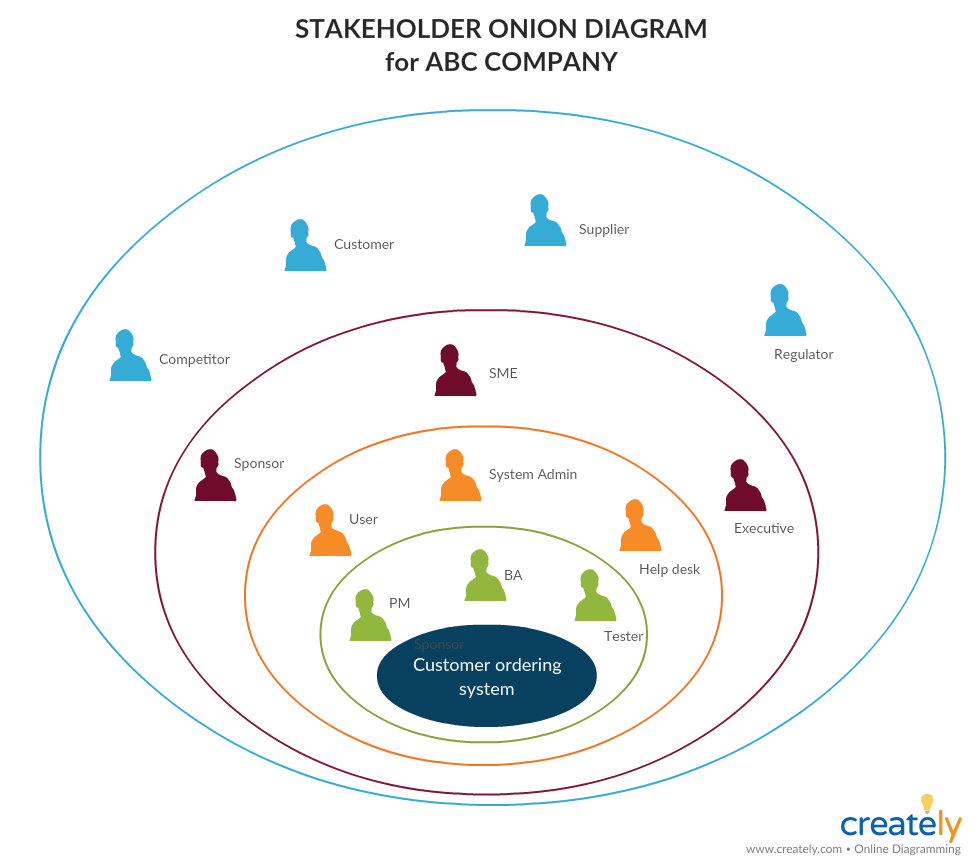
Hi, I’m trying to draw a simple onion diagram for stakeholder analysis. Please, see examples [1], or [2].
Am I taking the right approach here by using nested subgraphs in the code snippet below?
I haven’t quite grasped the dot syntax yet and would greatly appreciate your help!
In the ballpark. A subgraph is more of a subset or grouping, and does not produce a physical shape. What you probably want is a cluster subgraph (I suggest reading the Dot User Guide https://www.graphviz.org/pdf/dotguide.pdf)
Anyway, clusters can’t be oval-shaped, but they can be rounded rectangles. Maybe close enough for your needs.
Except for the patchwork algorithm, the Graphviz algorithms are focused on producing node-link diagrams for combinatorial graphs. The raw data here consists of nested sets, with no explicit edges, and the desired layout is not a node-link diagram. None of the Graphviz algorithms will give you what you want, with Steve’s suggestion being about the best you can do. The underlying graphics model can draw what you want, but this would require someone to write the algorithm to convert your data into the output you want.
Hi @steveroush, thank you for your prompt response. Even though it’s not exactly the shape I was looking for, I’ve learnt a great deal from the doc that you’ve linked!
First let’s note that Graphviz is not well suited to producing Onion diagrams. Graphviz can produce many cool graphs, but Onion diagrams weren’t on the requirements list.
If you are only intending to produce one or two of these diagrams, a gui-based drawing program might be best.
If you want to automate the process, you might also look at dpic (Dpic distribution). A bit lower-level, but more explicit positioning commands.
If you are still interested in using Graphviz, here is a way to get nested ellipses:
graph nest {
// built by hand/eyeball
node [shape=ellipse fixedsize=true]
a [width=3 height=2.2 pos=“400,100” label=“first\n\n\n\n\n\n\n” ]
b [width=2 height=1.4 pos=“400,75” label=“second\n\n\n\n\n” ]
c [width=1 height=.8 pos=“400,60” label=“third” ]
Instead of using dot, this uses neato -n (see the FAQ FAQ | Graphviz)
The downside is that you have to provide all the positioning and sizing - a pain the first time, but pretty easy to automate


