How to make nodes overlap in Graphviz?

I want to make some of the nodes in my graph to overlap in the following manner:
Screen Shot 2023-02-27 at 12.45.25 AM

I am using pygraphviz to render graphs.

I understand that using the neato engine would help in achieving something like this, but some components of my graph require me to use the dot engine.
Is there any workaround to this?

questions:

  • are the overlapping nodes just “decorative” or will there also be edges
  • do you want to create the overlapping nodes manually or programmatically
  • can you identify in advance which nodes will be overlapped (the big nodes)
  • will you always know in advance where to place the overlapping nodes?

Hi, thank you for your response!
These are the answers to the questions:

  1. There will also be edges
  2. Programmatically, ideally in the centre of the larger node
  3. Yes
  4. The idea is to have them in the centre of line of the big nodes, so I will initially need to calculate the size of that and then place the overlapping nodes in the centre

Maybe we can to this the “easy” way (just dot, no other fooling around)

This appears to be a node within another node, it actually is just a single (odd) html node (Node Shapes | Graphviz)
Might this work?

// square within a square
digraph {
  S [shape=none XXmargin=0 label=
<<table border="1" cellspacing="1" cellborder="1">
 <tr>
  <td width="30" height="30" fixedsize="true" style="invis"></td>
  <td width="10" height="30" fixedsize="true" style="invis"></td>
  <td width="30" height="30" fixedsize="true" style="invis"></td>
 </tr>
  <tr>
  <td width="30" height="10" fixedsize="true" style="invis"></td>
  <td width="10" height="10" fixedsize="true" sides="tblr" port="p1" ></td>
  <td width="30" height="10" fixedsize="true" style="invis"></td>
 </tr>
 <tr>
  <td width="30" height="30" fixedsize="true" style="invis"></td>
  <td width="10" height="30" fixedsize="true" style="invis"></td>
  <td width="30" height="30" fixedsize="true" style="invis"></td>
 </tr>
</table>>]

a -> S:p1
S:p1 -> b
}

nodeInNode

Thank you for the response. However, I wanted my output to look like the one shown in the image above. I wanted to know if there is any way to do that in dot or any other way.

If you want very detailed control over the final image, I expect perhaps an SVG editor would be a better fit for you than Graphviz

I want to programmatically draw the graphs, so probably an svg editor would not be a good choice.

Will the “big” node have edges to/from it, or will only the “little” nodes have edges?

In this case, edges would be present for both the “big” and “little” nodes.

Could you perhaps show a more detailed example? I cant tell if your example has 3 nodes or 2 nodes and 2 edges.

You could possibly programatically generate SVG too if you want to write your own layout of small graphs. How big (node count, edge count) are your graphs?

On a high level, it would look something like this, with maybe a lot more “big” nodes and more relationships than the ones I have shown in the image.

Are you trying to show internal and external interfaces/methods/whatever?
If so, I have a fuzzy idea, let me play for a bit.

Below I have a graph of three made-up (unnamed) subsystems, each is represented by two, nested clusters. The outer cluster shows the external interfaces & the inner cluster shows the “hidden” (internal-only) interfaces.
The details of the graphics are not what you requested, but are the basic “rules and regulations” of the graphics close-ish?

Yes! I just need to figure out a way to have the small nodes overlap with the big ones.

While I believe it is possible to re-size & reposition the outer cluster rectangle to overlap the contained nodes, I suggest you consider relaxing your requirements.

Accomplishing the above would require running dot with output in the dot format, altering the bb attribute (bounding box - bb | Graphviz) - based on the pos of the “nearest” contained node, and then submitting the result to neato -n2. All (probably?) doable with the python interface, but non-trivial.

If you are not nodding your head and thinking, “OK, I get it”, I suggest you consider something in the neighborhood of the graph below. Easy to produce programmatically, requiring just a single dot pass, and very mainstream usage of the Graphviz language.

Input file (not programmatically created, but it could have been):

// externals & internals 
digraph {
  // peripheries
  subgraph clusterext1{
    graph [ style=filled fillcolor=lightblue  label="obj XYZ" labeljust=l]
  {rank=same top=true ext1a ext1b}
  {rank=same bottom=true ext1c}  
  subgraph clusterint1{
    graph [ style=filled fillcolor=lightpink label=""]
    node [shape=rect]
    int1a -> int1b ->{int1c int1d} -> int1e
    int1a -> int1e
  }
    ext1a -> int1a
    ext1b -> int1a
    int1e -> ext1c
    int1c -> ext1c
  }
  subgraph clusterext2{
    graph [ style=filled fillcolor=lightblue label="obj wow" labeljust=l]
  {rank=same top=true  ext2a}
  {rank=same bottom=true ext2b}    
  subgraph clusterint2{
    graph [ style=filled fillcolor=lightpink  label=""]
    node [shape=rect]
    int2a int2b int2c int2d 
  }
  ext2a -> int2a-> {int2b int2c int2d } -> ext2b
  }
  subgraph clusterext3{
    graph [ style=filled fillcolor=lightblue label="And More" labeljust=l]
    {rank=same ext3a}
    {rank=same ext3b}
    // no internal objects
  }
  start -> {ext1a ext1b}
  ext1c -> ext2a
  ext2b -> ext3a
  ext3a -> ext3b
  ext3b -> "The End"
}

This kind of makes sense, thank you so much for your help.
I would have to experiment with the part about running once in dot and then in neato through Python, but this helps a lot.

Thank you once again!

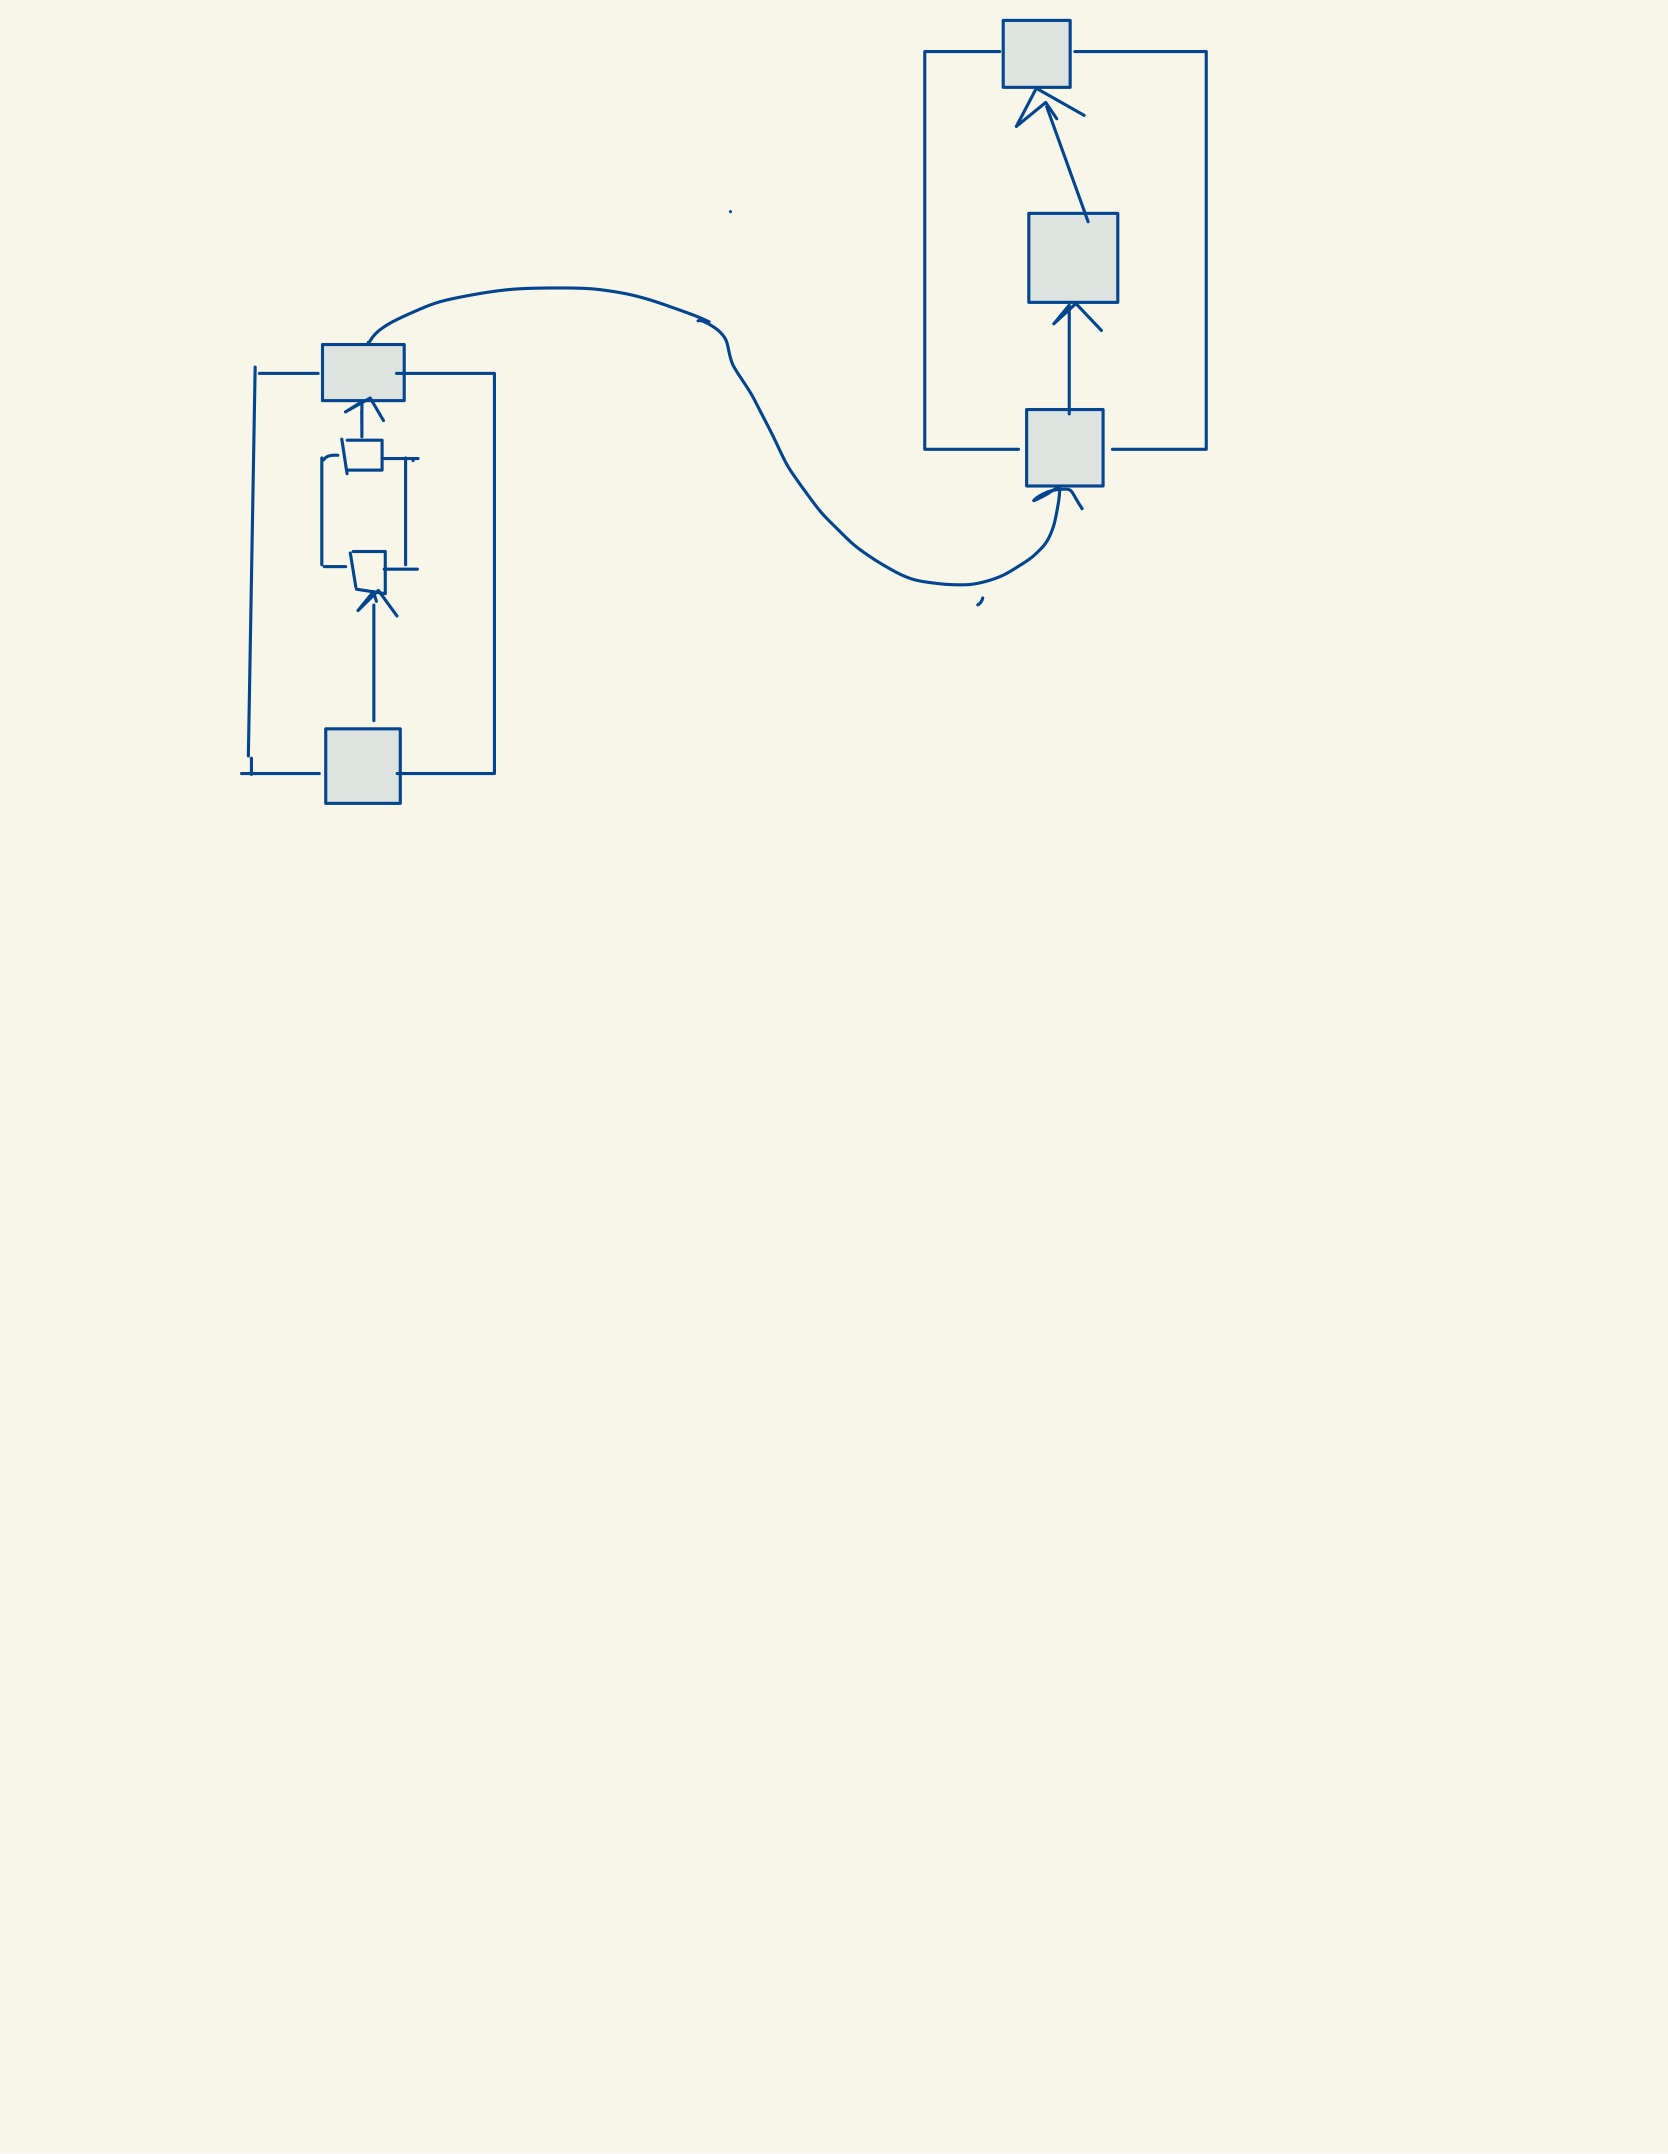
FYI, here is a hand-edited version of the above with modified bounding box & all nodes filled with white (i.e. not transparent). Also note that the cluster labels are now outside the cluster.
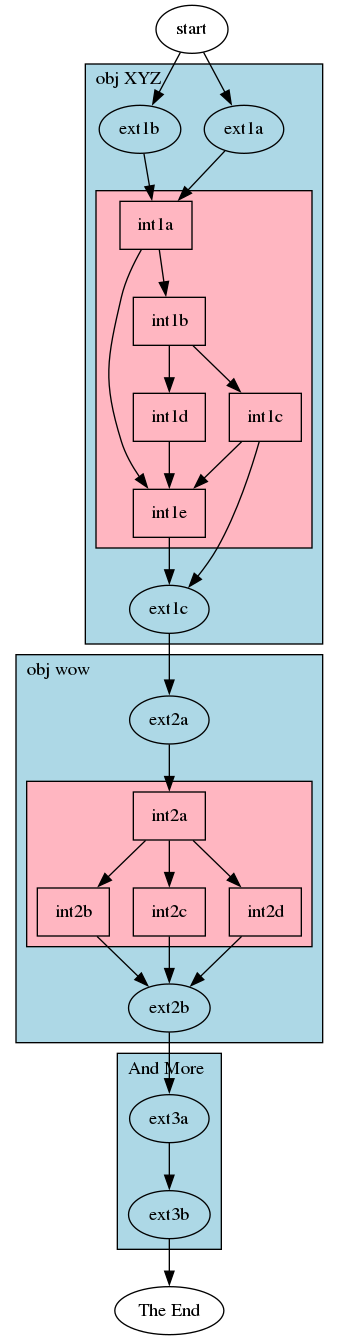
digraph {
	graph [bb="0,0,246,997"];
	node [label="\N" style=filled fillcolor=white]; // added fill
	{
		ext1a	[height=0.5,
			pos="179,904",
			width=0.83048];
		ext1b	[height=0.5,
			pos="101,904",
			width=0.84854];
	}
	subgraph clusterext1 {
		graph [//bb="60,518,238,953",
                        bb="60,540,238,910",  // hand edited to adjust bb	
			fillcolor=lightblue,
			label="obj XYZ",
			labeljust=l,
			lheight=0.21,
			lp="92.5,941.5",
			lwidth=0.68,
			style=filled
		];
		{
			graph [rank=same,
				top=true
			];
			ext1a;
			ext1b;
		}
		{
			graph [bottom=true,
				rank=same
			];
			ext1c	[height=0.5,
				pos="123,544",
				width=0.83048];
		}
		subgraph clusterint1 {
			graph [bb="68,590,230,858",
				fillcolor=lightpink,
				label="",
				style=filled
			];
			node [shape=rect];
			{
				int1c	[height=0.5,
					pos="195,688",
					width=0.75];
				int1d	[height=0.5,
					pos="123,688",
					width=0.75];
			}
			int1a	[height=0.5,
				pos="113,832",
				width=0.75];
			int1b	[height=0.5,
				pos="123,760",
				width=0.75];
			int1a -> int1b	[pos="e,120.56,778.1 115.47,813.7 116.53,806.32 117.78,797.52 118.96,789.25"];
			int1e	[height=0.5,
				pos="123,616",
				width=0.75];
			int1a -> int1e	[pos="e,107.39,634.23 101.95,813.61 96.263,803.62 89.919,790.58 87,778 76.149,731.24 72.892,715.88 87,670 89.882,660.63 95.048,651.42 \
100.58,643.39"];
			int1b -> int1c	[pos="e,177.16,706.35 140.8,741.7 149.28,733.45 159.59,723.43 168.93,714.35"];
			int1b -> int1d	[pos="e,123,706.1 123,741.7 123,734.41 123,725.73 123,717.54"];
			int1c -> int1e	[pos="e,140.84,634.35 177.2,669.7 168.72,661.45 158.41,651.43 149.07,642.35"];
			int1d -> int1e	[pos="e,123,634.1 123,669.7 123,662.41 123,653.73 123,645.54"];
		}
		ext1a -> int1a	[pos="e,129.15,850.13 164.68,887.81 156.59,879.23 146.26,868.27 136.97,858.42"];
		ext1b -> int1a	[pos="e,110.07,850.1 103.97,885.7 105.23,878.32 106.74,869.52 108.16,861.25"];
		int1c -> ext1c	[pos="e,136.97,559.94 190.43,669.8 184.72,649.83 173.86,616.26 159,590 154.8,582.58 149.4,575.11 144.08,568.45"];
		int1e -> ext1c	[pos="e,123,562.1 123,597.7 123,590.41 123,581.73 123,573.54"];
	}
	subgraph clusterext2 {
		graph [//bb="8,219,238,510",
                        bb="8,251,238,472"  // hand edited
			fillcolor=lightblue,
			label="obj wow",
			labeljust=l,
			lheight=0.21,
			lp="40,498.5",
			lwidth=0.67,
			style=filled
		];
		{
			graph [rank=same,
				top=true
			];
			ext2a	[height=0.5,
				pos="123,461",
				width=0.83048];
		}
		{
			graph [bottom=true,
				rank=same
			];
			ext2b	[height=0.5,
				pos="123,245",
				width=0.84854];
		}
		{
			int2b	[height=0.5,
				pos="51,317",
				shape=rect,
				width=0.75];
			int2c	[height=0.5,
				pos="123,317",
				shape=rect,
				width=0.75];
			int2d	[height=0.5,
				pos="195,317",
				shape=rect,
				width=0.75];
		}
		subgraph clusterint2 {
			graph [bb="16,291,230,415",
				fillcolor=lightpink,
				label="",
				style=filled
			];
			node [shape=rect];
			int2a	[height=0.5,
				pos="123,389",
				width=0.75];
			int2b;
			int2a -> int2b	[pos="e,68.843,335.35 105.2,370.7 96.721,362.45 86.412,352.43 77.07,343.35"];
			int2c;
			int2a -> int2c	[pos="e,123,335.1 123,370.7 123,363.41 123,354.73 123,346.54"];
			int2d;
			int2a -> int2d	[pos="e,177.16,335.35 140.8,370.7 149.28,362.45 159.59,352.43 168.93,343.35"];
		}
		ext2a -> int2a	[pos="e,123,407.1 123,442.7 123,435.41 123,426.73 123,418.54"];
		int2b -> ext2b	[pos="e,107.84,260.74 68.798,298.7 78.167,289.59 89.77,278.31 99.833,268.52"];
		int2c -> ext2b	[pos="e,123,263.1 123,298.7 123,291.41 123,282.73 123,274.54"];
		int2d -> ext2b	[pos="e,138.16,260.74 177.2,298.7 167.83,289.59 156.23,278.31 146.17,268.52"];
	}
	subgraph clusterext3 {
		graph [//  bb="84,64,162,211",
		      bb="84,94,162,171",		
			fillcolor=lightblue,
			label="And More",
			labeljust=l,
			lheight=0.21,
			lp="121,199.5",
			lwidth=0.81,
			style=filled
		];
		{
			graph [rank=same];
			ext3a	[height=0.5,
				pos="123,162",
				width=0.83048];
		}
		{
			graph [rank=same];
			ext3b	[height=0.5,
				pos="123,90",
				width=0.84854];
		}
		ext3a -> ext3b	[pos="e,123,108.1 123,143.7 123,136.41 123,127.73 123,119.54"];
	}
	ext1c -> ext2a	[pos="e,123,479.43 123,525.82 123,515.69 123,502.6 123,490.92"];
	ext2b -> ext3a	[pos="e,123,180.43 123,226.82 123,216.69 123,203.6 123,191.92"];
	"The End"	[height=0.5,
		pos="123,18",
		width=1.1374];
	ext3b -> "The End"	[pos="e,123,36.104 123,71.697 123,64.407 123,55.726 123,47.536"];
	start	[height=0.5,
		pos="140,979",
		width=0.75];
	start -> ext1a	[pos="e,170.1,921.66 148.66,961.8 153.39,952.95 159.36,941.75 164.76,931.65"];
	start -> ext1b	[pos="e,109.9,921.66 131.34,961.8 126.61,952.95 120.64,941.75 115.24,931.65"];
}

Giving: