I have been experimenting with Graphviz for a project where I need to display some pretty complex relationships between entities. I have managed to build a few small graphs that look fine but once the data grows bigger the layout starts to feel messy & harder to follow. Also I have tried tweaking ranks, using subgraphs & even manually adjusting positions but I am still struggling to keep the structure clear without it looking such as a big spaghetti diagram.
Has anyone here dealt with large-scale graphs where readability is critical? Are there certain tricks or best practices you follow; maybe with attributes such as rankdir or node grouping, that help keep things neat? Also; if you have integrated Graphviz with other tools or languages, I want to hear how you handled rendering for bigger datasets.
I have also been going through a Rails course which makes me appreciate how different tools approach visualization & structuring.
Thank you for trying our software, and for bringing up an interesting problem.
The network visualization field has struggled for many years with effectively visualizing large, complex networks. It’s possible that with some data sets, there is a “small world” effect where the network has low diameter, so with typical layout objective functions, the goal is to place many (too many) nodes “close” to other nodes, and this isn’t possible without a lot of clutter and occlusion.
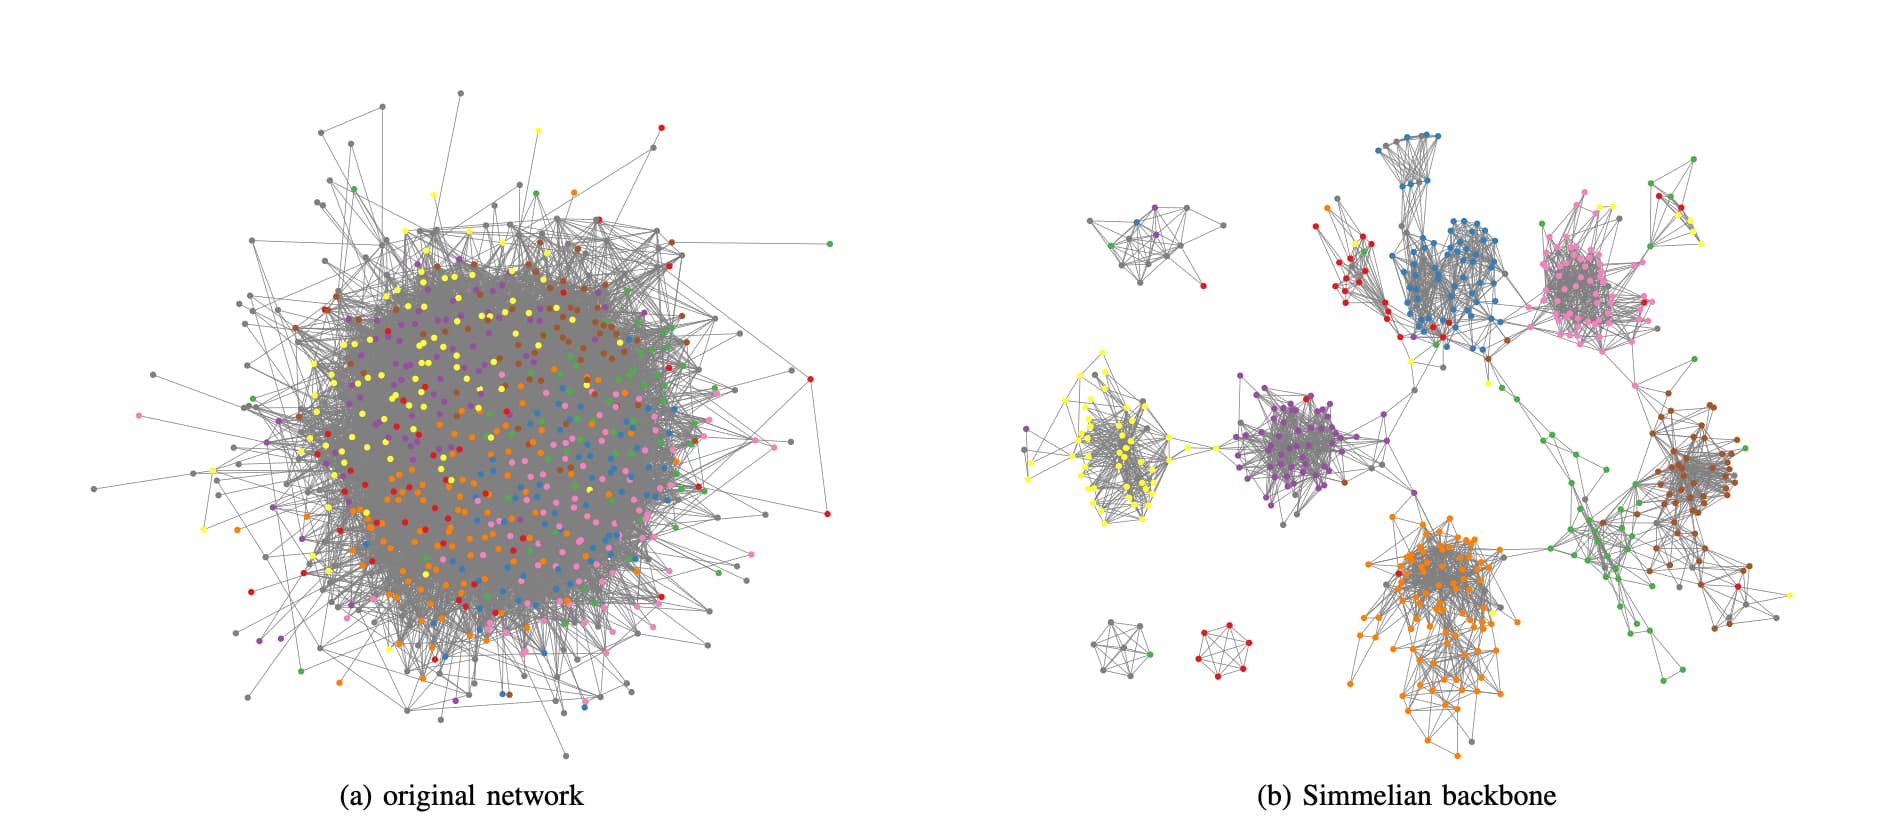
One idea is to discard the shortest-path distance distance model and try alternatives like “resistor circuit” or “simmelian backbone.” In graphviz neato, -Gmodel=subset can do some of this. (A fly in the ointment is that neato itself runs an N^2 solver, so kind of slow on large networks. The subset model considers only node triangles; we have graphviz code somewhere that relaxes this constraint and does the full model published in the Nick,Lee,Cunningham,Brandes paper https://dl.acm.org/doi/10.1145/2492517.2492569). I think Emden wrote it See the following.
If trying to wring performance out of this, one might consider the graphviz stochastic gradient descent solver, which does handle distances. (sfdp, the more scalable alternative to neato in graphviz, does not handle distances.)
Looking at competitors to graphviz, I think cytoscape has the umap algorithm (highly scalable manifold embedding), and Gephi has ForceAtlas2 that may handle simmelian backbones too, or at least some kind of “modularity clustering.”
Example: hide edges / dim them until the nodes they are connected to, are clicked. Makes a world of difference when you want to explain something. This does mean the person viewing the diagram needs to view it on a computer, so in printed form it may be hard to convey that same level of information.
Having your own input format, and a program to transform it into the diagramming tool
Dot is probably not super user-friendly to write by hand to play with layouts, though it is essential to write it by hand to understand what it does, before being able to do that conversion and create a relatively well-laid-out dot diagram.
I wrote https://azriel.im/dot_ix/ which uses dot and applies styling, which implements the latter two ideas (I’m still figuring out how to do the first one). It’s not “stable” in the sense that if you create a diagram today, the same input format may not work tomorrow (but you can save the SVG, that will always work).