How to extend page size and get a perfect curved edge?

Hello graphvizers,
I’m currently drawing a graph with Graphviz. However, the dot engine seems too stingy on page size, which leads to a weird shape of an edge:
logical

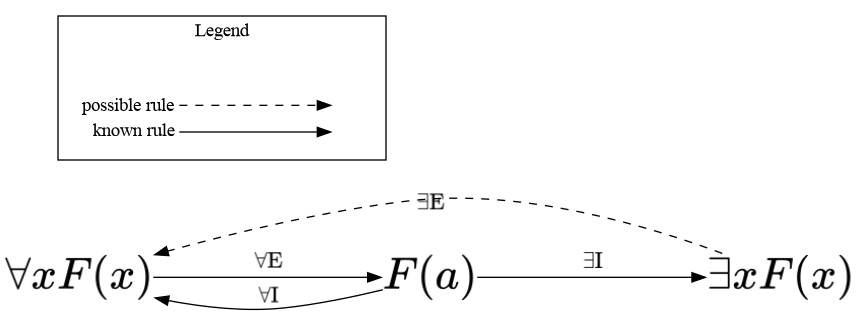
You might observe the dashed edge at the bottom looks strange. Is there any way I could make it curved and extend the page size of the graph?

digraph proofs {
	rankdir=LR
	page="7"
	splines=true
	node [shape=none label="" width=.2 height=.2]
	node [imagescale=true]
	edge [shape=none label="" ]
	edge [imagescale=true]

	allx [image="images/forallx_large.png"]
	onex [image="images/existsx_large.png"]
	fofa [image="images/fofa_large.png"]

	allx->fofa [label = <<TABLE BORDER="0" ><TR><TD><IMG SCALE="TRUE" SRC="images/universalelimination_small.png"/></TD></TR></TABLE>> minlen=2]
	fofa->allx [label = <<TABLE BORDER="0"><TR><TD><IMG SCALE="TRUE" SRC="images/universalintroduction_small.png"/></TD></TR></TABLE>> minlen=2]
	fofa->onex [label = <<TABLE BORDER="0"><TR><TD><IMG SCALE="TRUE" SRC="images/existentialintroduction_small.png"/></TD></TR></TABLE>> minlen=2]
	onex->allx [style="dashed" label = <<TABLE BORDER="0"><TR><TD><IMG SCALE="TRUE" SRC="images/existentialelimination_small.png"/></TD></TR></TABLE> > minlen=3]

  subgraph legends { 
    label = "Legend";
    key [label=<<table border="0" cellpadding="2" cellspacing="0" cellborder="0">
      <tr><td align="right" port="i1">know rule</td></tr>
      <tr><td align="right" port="i2">possible rule</td></tr>
      </table>>]
    key2 [label=<<table border="0" cellpadding="2" cellspacing="0" cellborder="0">
      <tr><td port="i1">&nbsp;</td></tr>
      <tr><td port="i2">&nbsp;</td></tr>
      </table>>]
    key:i1:e -> key2:i1:w [style=dashed]
    key:i2:e -> key2:i2:w 
  }
}

I don’t have an answer to your arrow question, but you’re drawing logical transformation rules, right? Doesn’t ∃ elimination transform ∃x.F(x) into F(a)?

∃x. F(x)
  ∃E providing x = 6 ⇒
F(6)

I want to visually show my confusion to my logical philosophy instructor: he taught us the universal qualifier introduction rule, which we could introduce ∀xF(x) from F(a). Also the existential elimination rule, where ∃xF(x) and F(c)->B could result in B. So if we combine the universal qualifier introduction rule and the existential elimination rule, we could get ∀xF(x) from ∃xF(x). That’s really weird if we define predicate F as failing the philosophy course, any of us failing the course will lead to all of us failing the course ¯_(ツ)_/¯

Ah I see. Yes, anyone failing philosophy leading to everyone failing philosophy does indeed seem surprising :slight_smile:

(no thoughtful philosophy or logic comments, that was too long ago)
There are a couple of modest flaws in your graph, though they are not “the problem”

  • instead or page (postscript-only) you wanted size (with a trailing “!”)
  • the label attribute only applies to Root graphs and clusters

In my opinion, the best way to attach your legend to the graph is to create two distinct graphs and usr gvpack (http://www.graphviz.org/pdf/gvpack.1.pdf) to glue them together.
However, below is a reworked version of your graph including the legend. Because I did not have your images, may need to tweak things a bit :

digraph proofs {
	//rankdir=LR     // use std. ranking
	// size="7!"        // page is only for postscript
	splines=true
	node [shape=none label="" width=.2 height=.2]
	node [imagescale=true]
	edge [shape=none label="" ]
	edge [imagescale=true]
	nodesep=.6  // spread things out
	ranksep=.8  // spread things out

  {rank=same
	allx [image="images/forallx_large.png"]
	onex [image="images/existsx_large.png"]
	fofa [image="images/fofa_large.png"]
  }
	allx->fofa [label = <<TABLE BORDER="0" ><TR><TD><IMG SCALE="TRUE" SRC="images/universalelimination_small.png"/></TD></TR></TABLE>> minlen=2]
	fofa->allx [label = <<TABLE BORDER="0"><TR><TD><IMG SCALE="TRUE" SRC="images/universalintroduction_small.png"/></TD></TR></TABLE>> minlen=2]
	fofa->onex [label = <<TABLE BORDER="0"><TR><TD><IMG SCALE="TRUE" SRC="images/existentialintroduction_small.png"/></TD></TR></TABLE>> minlen=2]
	onex->allx [style="dashed" label = <<TABLE BORDER="0"><TR><TD><IMG SCALE="TRUE" SRC="images/existentialelimination_small.png"/></TD></TR></TABLE> > minlen=3]

  subgraph clusterlegends { 
    label = "Legend";
    {rank=same
    key [label=<<table border="0" cellpadding="2" cellspacing="0" cellborder="0">
      <tr><td align="right" port="i1">know rule</td></tr>
      <tr><td align="right" port="i2">possible rule</td></tr>
      </table>>]
    key2 [label=<<table border="0" cellpadding="2" cellspacing="0" cellborder="0">
      <tr><td port="i1">&nbsp;</td></tr>
      <tr><td port="i2">&nbsp;</td></tr>
      </table>>]
    key:i1:e -> key2:i1:w [style=dashed]
    key:i2:e -> key2:i2:w
    }
  }
  key:i2:sw -> allx  [style=invis]  // place legend above graph
}

Giving:
rule1

Hi steveroush. Thanks your help. This looks amazing:


However, is it possible to make the image label above or below the line for the long dashed edge rather than crossing it? Here are the dot file after adjustment and the images:

digraph proofs {
	node [shape=none label="" ]
	node [imagescale=true]
	edge [shape=none label="" ]
	edge [imagescale=true]
	nodesep=.6  // spread things out
	ranksep=.8  // spread things out

  {rank=same
	allx [image="images/forallx_large.png"]
	onex [image="images/existsx_large.png"]
	fofa [image="images/fofa_large.png"]
  }
	allx->fofa [label = <<TABLE BORDER="0" ><TR><TD><IMG SCALE="TRUE" SRC="images/universalelimination_small.png"/></TD></TR></TABLE>> minlen=2]
	fofa->allx [label = <<TABLE BORDER="0"><TR><TD><IMG SCALE="TRUE" SRC="images/universalintroduction_small.png"/></TD></TR></TABLE>> minlen=2]
	fofa->onex [label = <<TABLE BORDER="0"><TR><TD><IMG SCALE="TRUE" SRC="images/existentialintroduction_small.png"/></TD></TR></TABLE>> minlen=2]
	onex->allx [style="dashed" label = <<TABLE BORDER="0"><TR><TD><IMG SCALE="TRUE" SRC="images/existentialelimination_small.png"/></TD></TR></TABLE> > minlen=3]

  subgraph clusterlegends { 
    label = "Legend";
    {rank=same
    key [label=<<table border="0" cellpadding="2" cellspacing="0" cellborder="0">
      <tr><td align="right" port="i1">possible rule</td></tr>
      <tr><td align="right" port="i2">known rule</td></tr>
      </table>>]
    key2 [label=<<table border="0" cellpadding="2" cellspacing="0" cellborder="0">
      <tr><td port="i1">&nbsp;</td></tr>
      <tr><td port="i2">&nbsp;</td></tr>
      </table>>]
    key:i1:e -> key2:i1:w [style=dashed]
    key:i2:e -> key2:i2:w
    }
  }
  key:i2:sw -> allx  [style=invis]  // place legend above graph
}

universalintroduction_small.png
universalelimination_small.png
existentialintroduction_small.png
existentialelimination_small.png
forallx_large.png
fofa_large.png
existsx_large.png

Just my 2c: for such a small graph, and wanting exact layout, you might be better off with an SVG editor rather than Graphviz.

Graphviz shines when you don’t know how to layout your graph (perhaps because it’s big), and Graphviz can do the layout for you. SVG editors are better at specifying exact layout and edge shapes.

This is good advice. The Graphviz path router has several main heuristics. An overview was published long ago: https://dl.acm.org/doi/10.1145/276884.276935

The edge router has a heuristic that looks for places where a straight axis-aligned segment can be made. This is meant to reduce the spaghetti effect that people still complain about.

This is an area of Graphviz where someone with some new ideas could pitch in. It might not be hard to disable this particular heuristic for individual edges or globally. Also, it might be nice to make multiple flat edges between the same endpoint more symmetric.

One thing that works against this is the abundance of features, like edge port constraints, labels, and the presence of other edges including self-edges (or loops).

There’s a more general question of what makes curved edges in diagrams look nice. It’s interesting that Gephi and probably some successors chose to have curved edges even if there are no constraints to prevent unwanted overlaps. We made this an option in Graphviz too (splines=curved as shown in splines | Graphviz) but it was probably coded in a half hour after a discussion over lunch in the cafeteria and might benefit from more work.

As mentioned elsewhere, Keenan Crane did some great work on a novel method of using repulsive forces between curves for various applications including graph drawing, and uses Graphviz as a bogey Keenan Crane - Repulsive Curves Also a nice intern-level project would be to implement this code in Graphviz.

We wonder if anyone has been able to characterize what people consider to be the most aesthetically pleasing and/or most readable curves drawn around obstacles in diagrams. Relevant properties include smoothness, shortness, symmetry, number of inflections, angular and euclidean separation. Placement of edge labels must also be considered.

To get the image off of the dotted line, change label to xlabel
Giving:

My 1c: I like the pikchr (Pikchr: Documentation) implementation of the PIC language. Though not gui, like Graphviz it is text based and scriptable. While it has no routing capabilities, it has more features than Graphviz in describing text placement, (relative) node placement, and simple edge placement.
I’d like to see some of these capabilities added to Graphviz - maybe in my next lifetime.

Graphviz can render to PIC, so it’s probably doable to write a translator in the other direction.