Excel to Graphviz v8.0 is here!
Download | Website | Github | Donate
This release of the Relationship Visualizer spreadsheet introduces enhancements across the Style Designer, Styles, and SQL capabilities, and improved performance.
Style Designer
- New gallery-style Ribbon controls replace dropdown lists
- New RGB color picking
- New image paths relative to workbook location
Styles
- New capability to easily reset the style designer to match a saved style format
SQL
- New SQL connection pooling
- New data source specification through the Ribbon UI
- New SQL commands for creating sequential edges and ranked-node subgraphs
Download | Website | Github | Donate
Full Version 8.0 Release Notes
 Style Designer
Galleries replace dropdown lists in the Ribbon
Image galleries replace dropdown lists for selecting colors, fonts, shapes, and ports offering faster, more intuitive style selection.
Color Galleries now display full color schemes in a compact, high-speed format. They quickly switch colors to match any color scheme selection.

Fonts are now previewed in a larger, gallery-style format using Graphviz-rendered font images for easier identification.
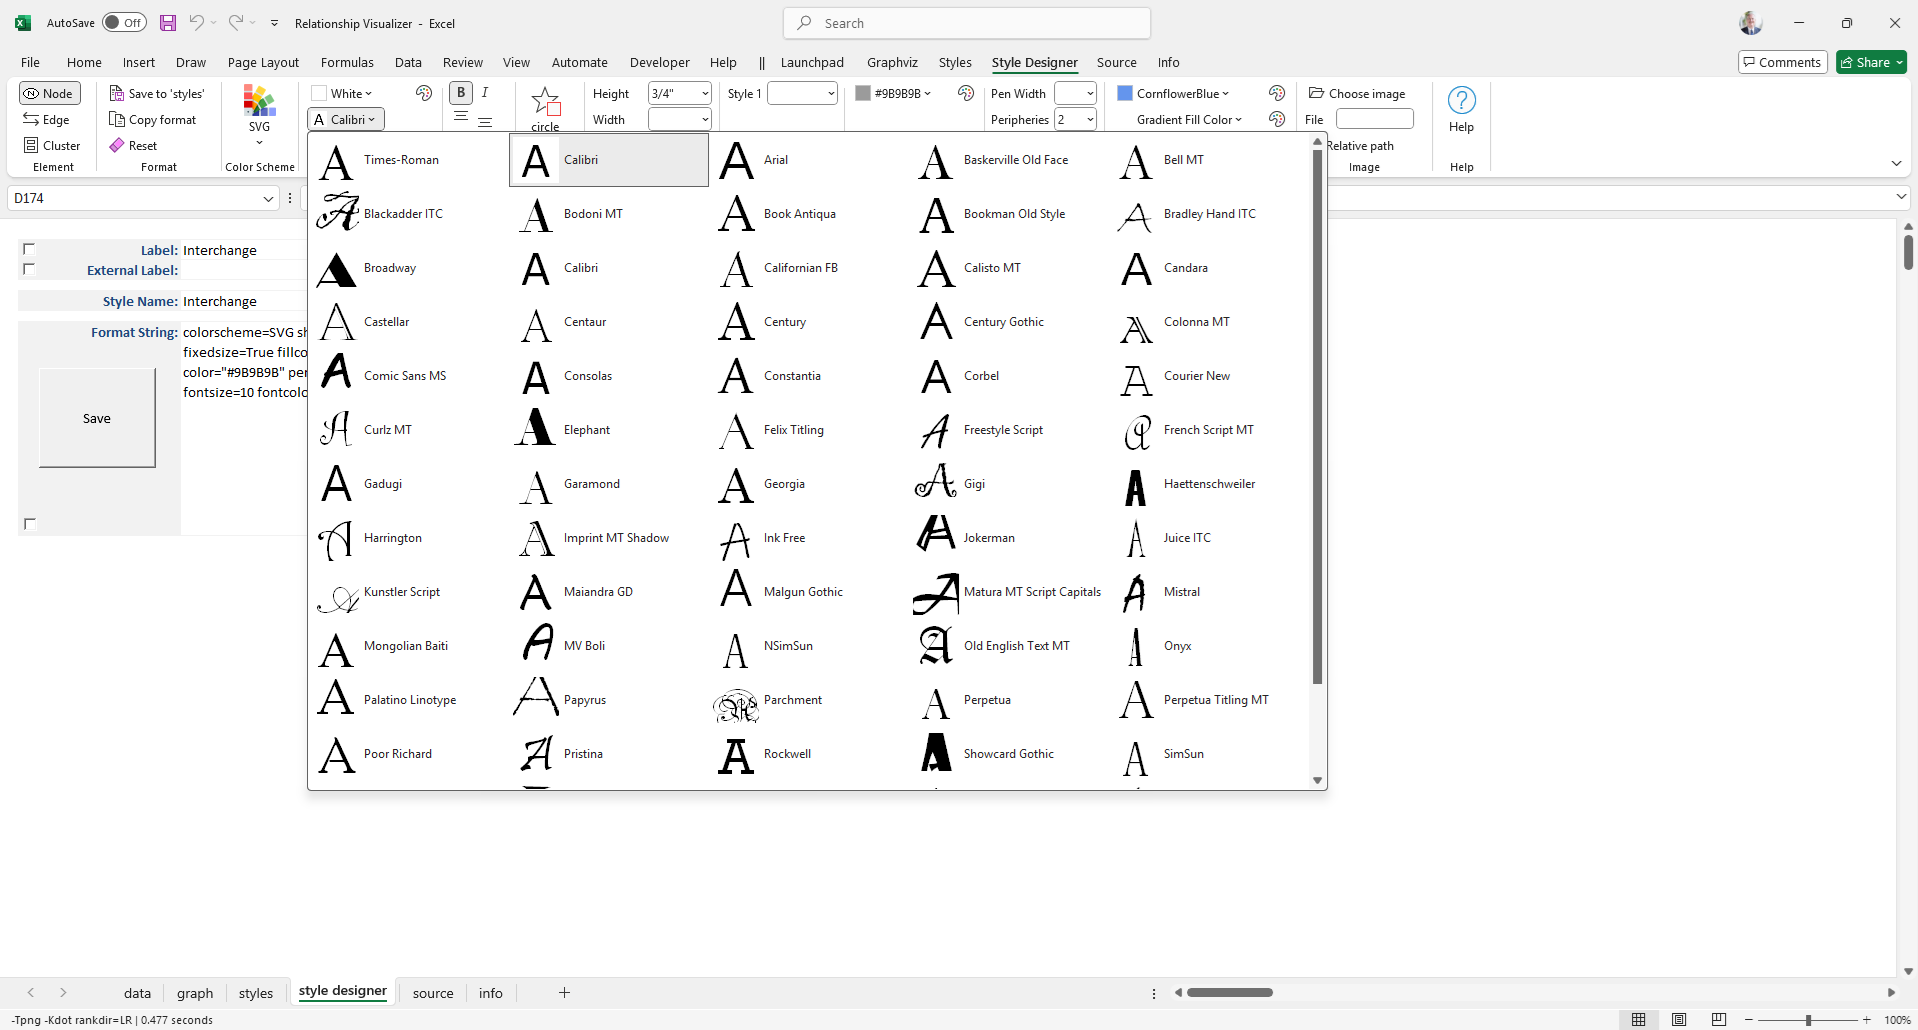
Logically grouped controls for node shapes, edge arrowheads/tails, and port options in galleries.

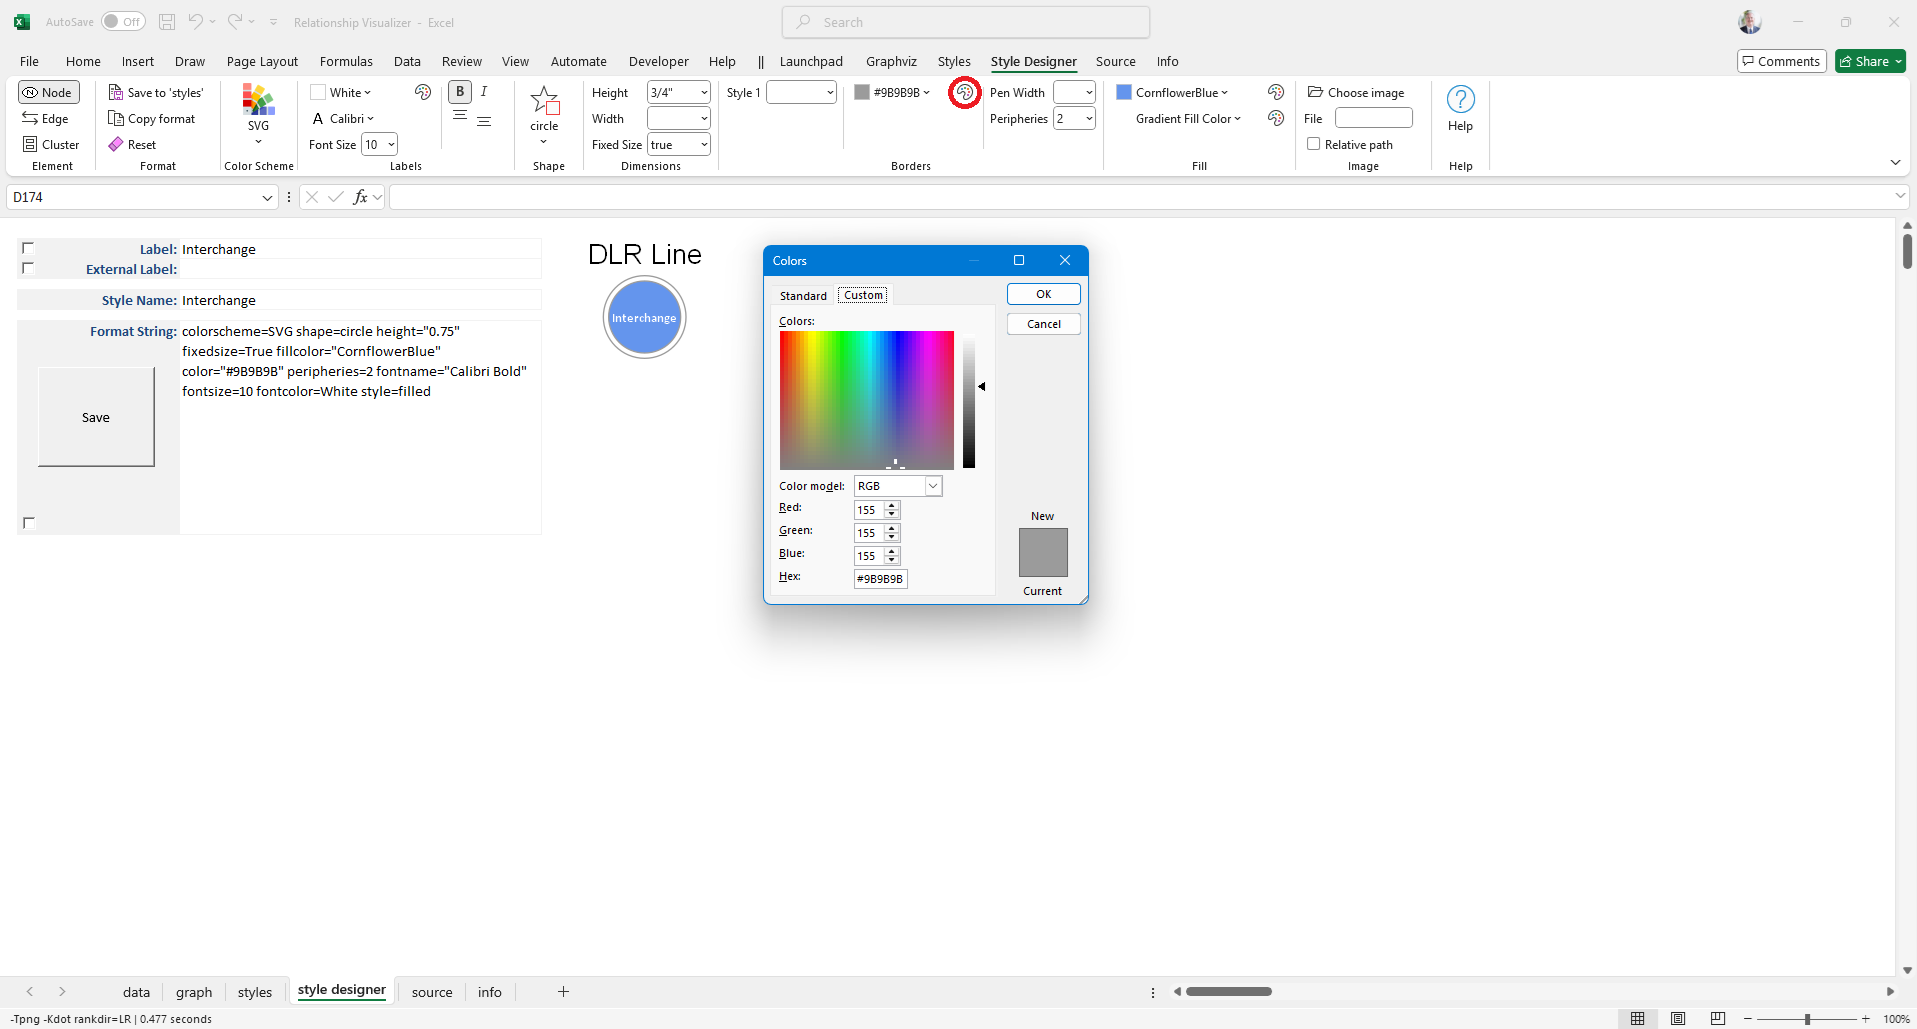
RGB Color Picker support added
RGB color picking support for label color, border color, edge colors, fill color, and gradient fill colors
Available on both Windows and macOS, using standard OS-provided file dialogs for seamless integration and familiar user experience.
Performance boosts
Faster font list filtering (Windows), optimized string routines, and pre-cached images enhance overall performance.
Eliminated the progress bar that versions 7.x and earlier displayed when loading large color sets (e.g. X11) and font names into dropdown lists.

Style Saving Enhancements
Labels (label, xlabel, taillabel, headlabel) can optionally be saved as part of the format string via checkbox.
Styles can now be named directly in the style designer worksheet prior to saving on the styles worksheet.
Added a prominent Save button in the worksheet canvas area for improved visibility and quicker access.

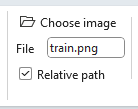
Image Path Handling
Added support for saving image file paths relative to the workbook location, enhancing portability across systems. For example, placing images in an images subfolder alongside the workbook allows relative paths to remain valid when the entire directory is cloned or moved.
 Styles
Restore saved styles in Style Designer
To modify a styles style, locate its row, click the [...] button, and the style designer UI will instantly reset to reflect the saved format, ensuring consistency and a clean editing baseline.
See a 90 second video of it in action on X (Twitter)
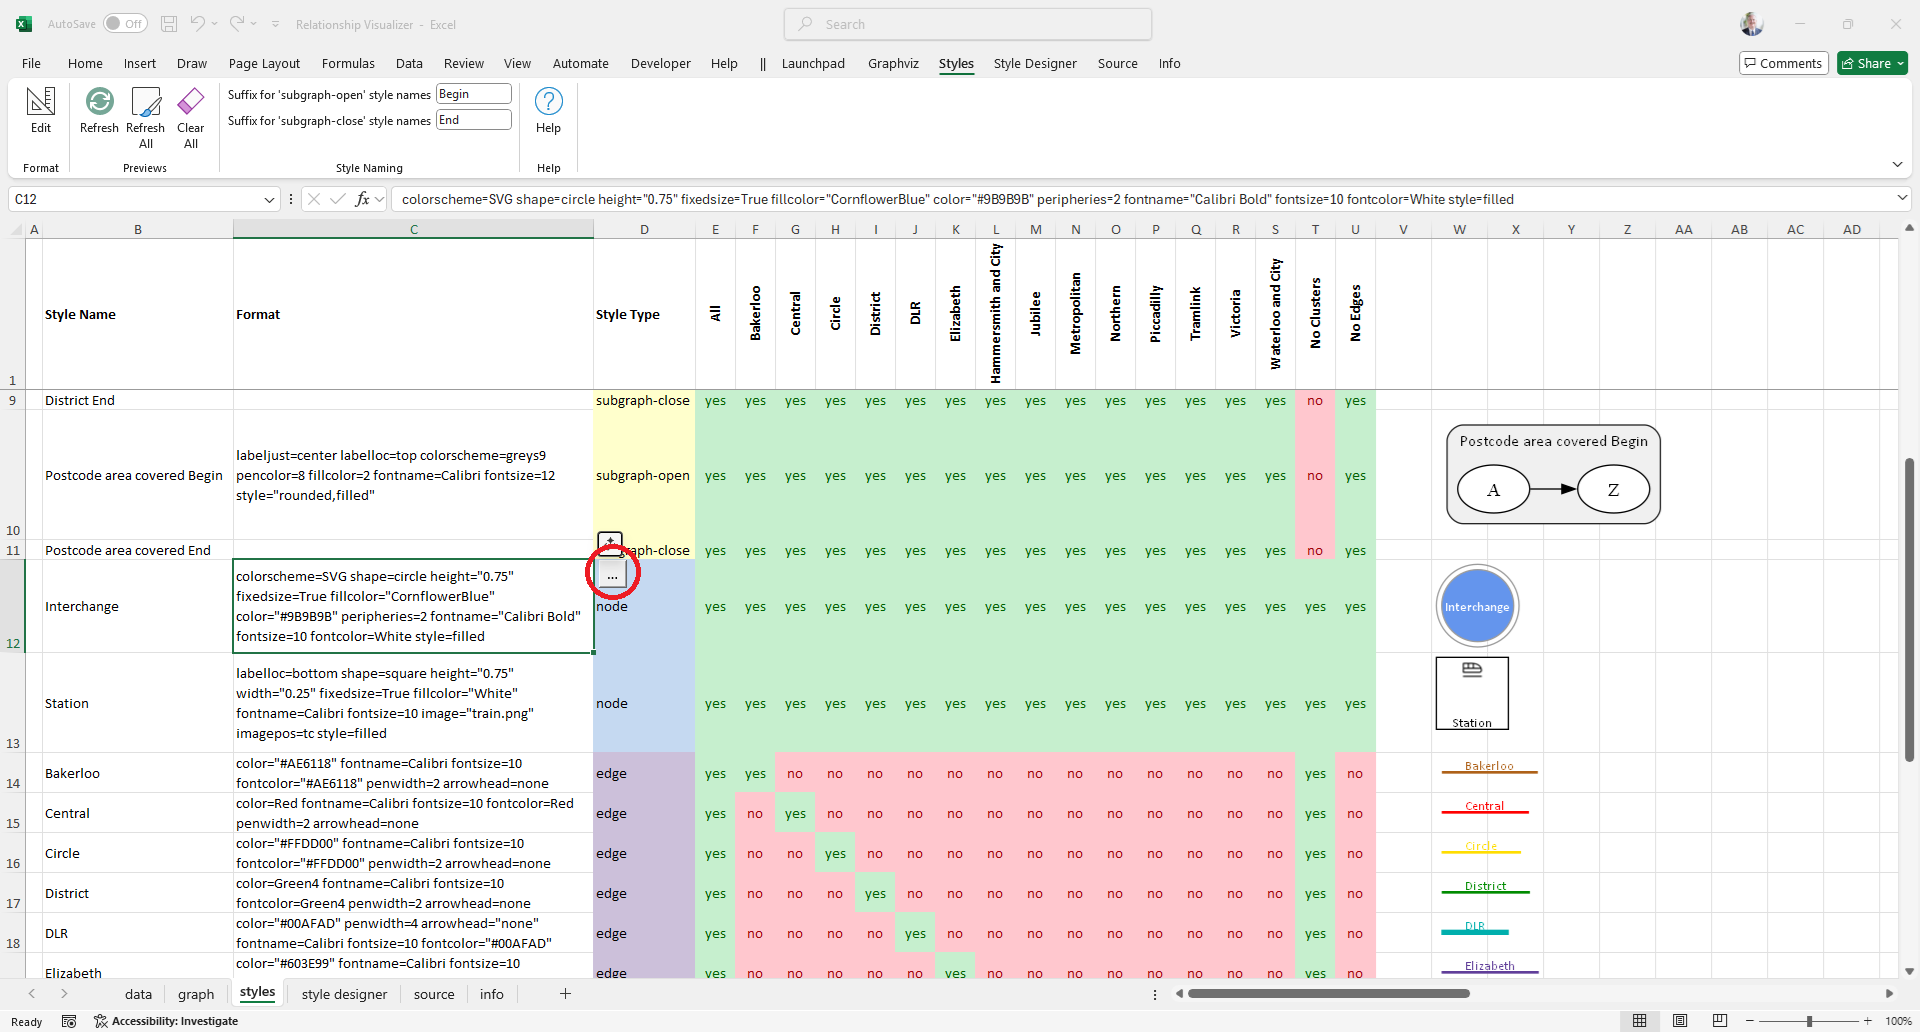
Close-up view. The [...] button appears to the right of the format string.

Auto-refresh of preview images
Style preview images now update instantly upon saving, so there’s no need to click the refresh button. The styles sheet reflects changes in real time
 SQL
SQL
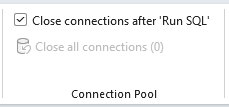
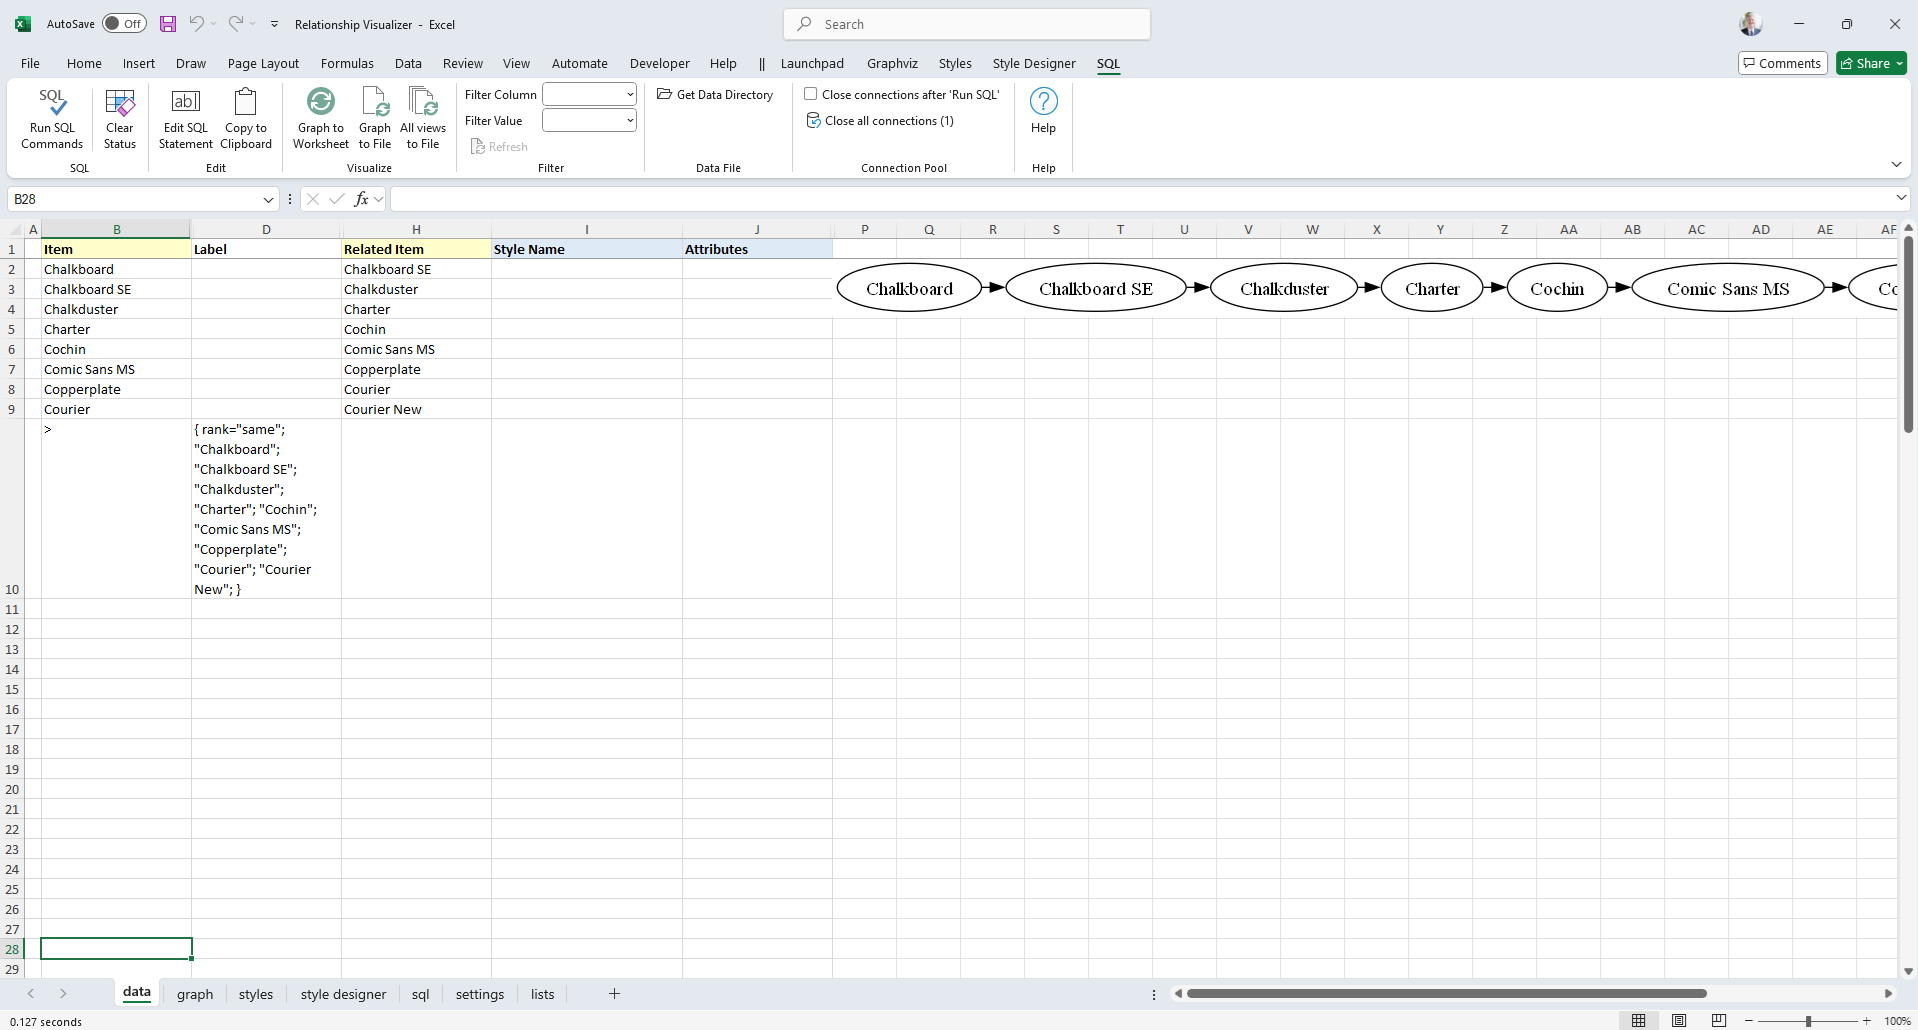
Connection Pooling added
Connection Pooling has been added to address Office 365 ADO latency introduced by Excel ADO connection issue in recent Office 365 update
Huge thanks to @BartB for identifying this Microsoft defect and for the generous collaboration that followed. Your help in testing and refining the workaround was key to delivering a robust interim solution while we await an official fix from Microsoft.
Default data source support added
New Ribbon controls allow you to set a default directory and workbook for SQL queries, streamlining execution and reducing repetitive setup. Once configured, queries automatically target the specified workbook and path. Choosing workbooks from the dropdown list is ideal for creating repeatable workflows which reuse SQL queries.

Graphviz SQL extensions added
Added SQL syntax extensions to simplify Graphviz data generation, including support for sequential edges and ranked-node subgraphs. These enhancements make it easier to visualize ordered flows and hierarchical relationships directly from query results.
Introduced CREATE EDGES syntax, which generates sequential edges from a SQL result set. These queries can be used for visualizing ordered flows, process chains, or node sequences in Graphviz diagrams.
For example, the following SQL statement
SELECT [Fonts] AS [Item],
       TRUE    AS [CREATE EDGES]
FROM   [Lists$]
WHERE  [Fonts] LIKE 'C%'
results in:

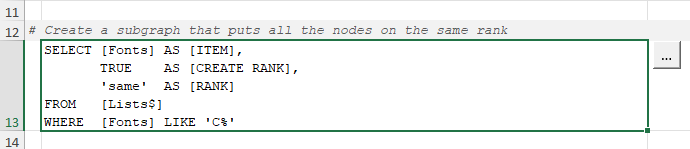
Introduced CREATE RANK syntax which inserts a Graphviz subgraph with nodes aligned to the specified rank, where nodes in the subgraph are from the query result set.
For example, the following SQL statement:
SELECT [Fonts] AS [ITEM],
       TRUE    AS [CREATE RANK],
       'same'  AS [RANK]
FROM   [Lists$]
WHERE  [Fonts] LIKE 'C%'
Results in:

When both SQL statements are run in sequence, the result is a batch of nodes positioned on the same rank, connected by sequential edges. This produces a clean, layered visualization where each node appears at the same vertical level (thanks to CREATE RANK), and the directional flow between them is defined by CREATE EDGES.
The results appear as follows:
New edit SQL button
New [...] button beside SQL statements opens SQL edit form.
 macOS Compatibility
- Fixed Excel version comparison logic for three-digit versions.
- Updated script version checks using integers.
- RGB controls hidden if outdated script detected.
 Miscellaneous
Performance optimizations
- Faster algorithm (Win OS) to exclude font names which Graphviz converts to ‘Arial’.
- Rewrote string comparisons and concatenations for faster execution.
- Removed progress bar when loading large color schemes. New speed makes them no longer needed.
- Images are now pre-cached at workbook open if available; otherwise, they’re generated on first use.
- New constants introduced for clarity and maintainability.
- Low-Memory Fix for image deletion on 32-bit Atom CPUs.