For fun, I experimented with positioning nodes based on geography (latitude & longitude). GPS systems are ubiquitous so finding coordinates of cities was pretty easy. Converting latitude & longitude into X-Y coordinates was more work, but I found the proj program and it will apply any of ~140 map projections. Unfortunately, I know almost nothing about mapping, but I muddled through. I piped latitude, longitude and city name into this command:
proj -r +proj=laea +lon_0=125w +lat_0=30n -m 1:5000
then into a small awk program to turn that into a dot input file, then into this:
neato -n2 -Tpng >cities.png
The dot looks like this (boring):
graph geo {
node [shape=point color=red label=""]
city1 [pos=“691.37,403.50” xlabel=“Cleveland”]
city2 [pos=“515.79,276.31” xlabel=“Kansas City”]
…
The output:
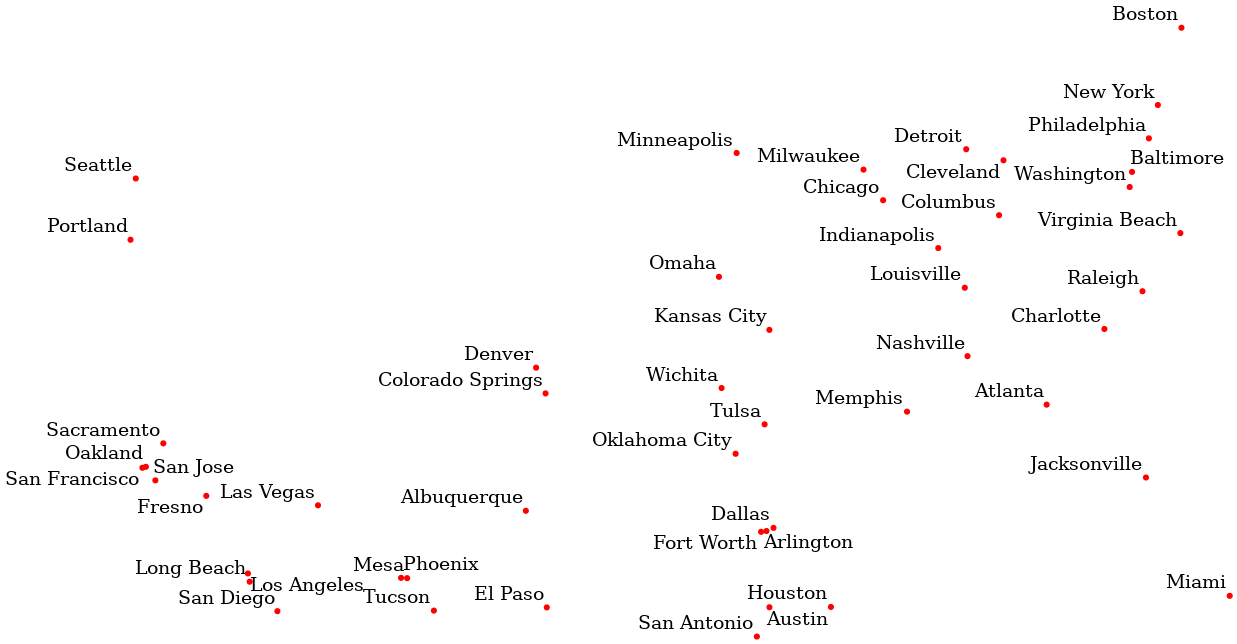
All in all, it works and is pretty script-able, but I expect that there are better ways to position nodes geographically. Though I haven’t used them for something like this, R and Qgis come to mind.