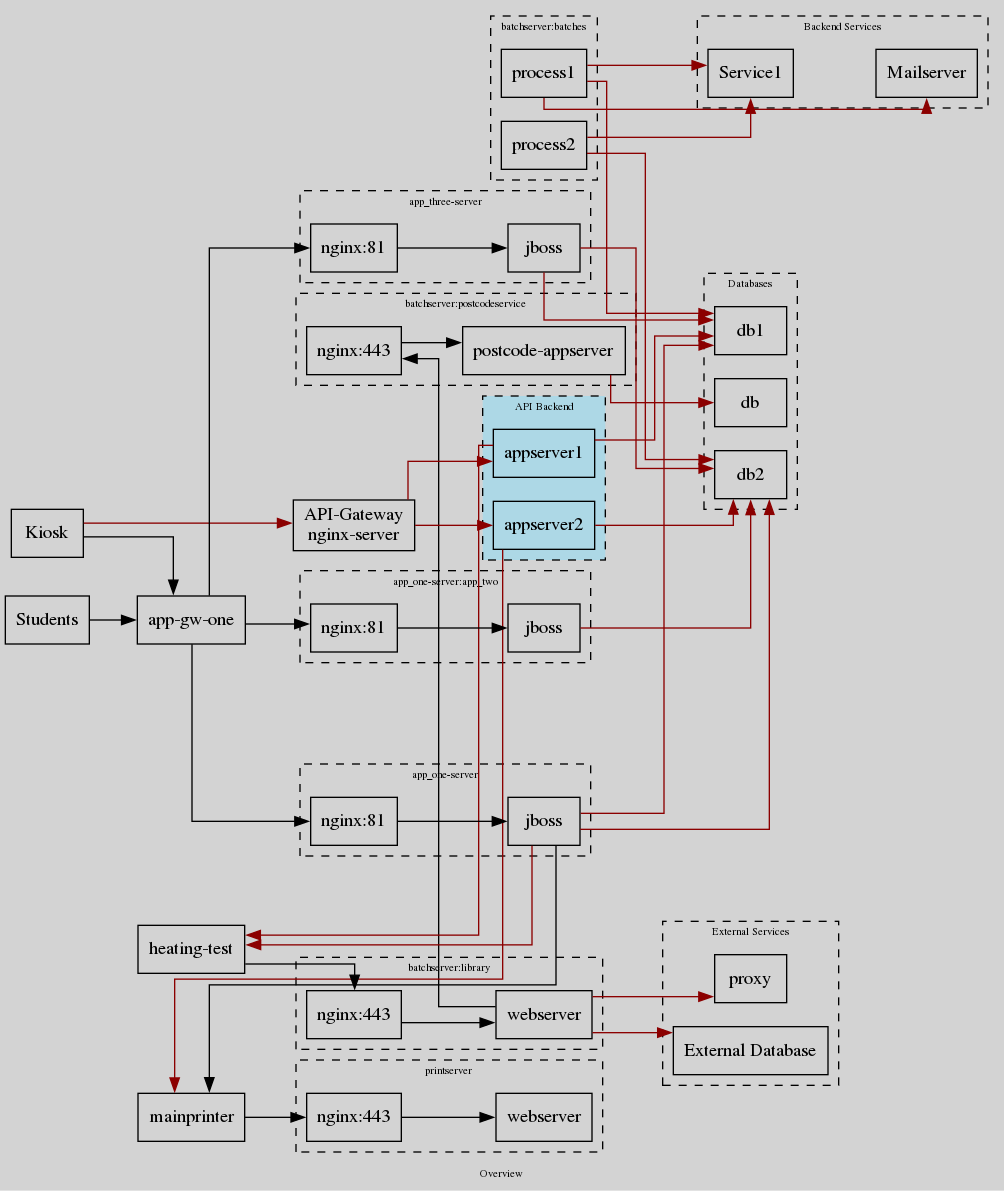
Hi there, I am very new at graphviz, but the output, what I want to generate, is very complex. I thought, it will be easier, but unfortunatelly, not. I tested it already on different versions, on different plattforms, i create already a docker for it, but no.
My problem is, that some of the containers are not showed, or it is mixed. The mixing is very strange, because I change the order of the line in the dot file, or delete an empty line, the output is different.
I am searching for a solution, what can I do?
Here is my dot file, and i run it in the bash with dot -Tsvg -O dotfile (in docker cat dotfile | docker … where the docker has the CMD “dot”,“-Tsvg”)
I just installed a very last, newest versions.
digraph {
	bgcolor="lightgray"
	rankdir="LR"

	label="Overview"
	fontsize="8"

	splines=ortho

	subgraph backservices_cl{
		cluster=true
		style=dashed
		label="Backend Services"
		edge [style=invis]
    	service1 [shape=box label="Service1"]
    	mailserver [shape=box label="Mailserver"]
    	service1 -> mailserver
	}

	subgraph databases_cl{
		cluster=true
		style=dashed
		edge [style=invis]
		label="Databases"

		db1 [ shape=box label="db1"]
		db2 [ shape=box label="db2"]
		db [ shape=box label="db"]


	}

	subgraph batches_cl{
		cluster=true
		style=dashed
		label="batchserver:batches"

		intserv1 [shape=box label="process1"]
		intserv2 [shape=box label="process2"]

		intserv1 -> service1 [color="#8b0000"]
		intserv2 -> service1 [color="#8b0000"]
		intserv1 -> db1 [color="#8b0000"]
		intserv2 -> db2 [color="#8b0000"]
		intserv1 -> mailserver [color="#8b0000"]
	}

	subgraph external_services_cl{
		cluster=true
		style=dashed
		label="External Services"

		proxy [shape=box label="proxy"]
		extdb [shape=box label="External Database" ]
	}

	subgraph heating_cl{
		cluster=true
		style=dashed
		label="batchserver:library"
		jboss_a [shape=box label="nginx:443"]
		appsa1 [shape=box label="webserver" ]

		jboss_a -> appsa1
		appsa1 -> extdb [color="#8b0000"]
		appsa1 -> proxy [color="#8b0000"]
	}

	subgraph postcode_cl{
		cluster=true
		style=dashed
		label="batchserver:postcodeservice"
		postcode [shape=box label="nginx:443"]
		jboss_postcode1 [shape=box label="postcode-appserver" ]

		jboss_postcode1 -> db [color="#8b0000"]
		postcode -> jboss_postcode1
	}

	subgraph api_cl{
		bgcolor="lightblue"
		style=dashed
		cluster=true
		label="API Backend"
		api_one [shape=box label="appserver1" ]
		api_two [shape=box label="appserver2" ]

		api_one -> db1 [color="#8b0000"]
		api_two -> db2 [color="#8b0000"]
	}

	subgraph printer_cl{
		cluster=true
		style=dashed
		label="printserver"
		printer [shape=box label="nginx:443"]
		jboss_printer [shape=box label="webserver" ]

		printer -> jboss_printer
	}

	user [ shape=box label="Students"]
	developer [ shape=box label="Kiosk"]
	heating [ shape=box label="heating-test"]
	applicationgw [ shape=box label="app-gw-one"]
	mainprinter [ shape=box label="mainprinter"]
	api_gw [shape=box label="API-Gateway\nnginx-server"]

	subgraph app_one_cl{
		cluster=true
		style=dashed
		label="app_one-server"
		app_one [shape=box label="nginx:81"]
		apps_one1 [shape=box label="jboss"]
	}

	subgraph app_two_cl{
		cluster=true
		style=dashed
		label="app_one-server:app_two"
		app_two [shape=box label="nginx:81"]
		apps_two1 [shape=box label="jboss"]
	}

	subgraph app_three_cl{
		cluster=true
		style=dashed
		label="app_three-server"
		app_three [shape=box label="nginx:81"]
		apps_three1 [shape=box label="jboss"]
	}

	{rank=same; heating applicationgw mainprinter}


	user -> applicationgw
	developer -> api_gw [color="#8b0000"]
	developer -> applicationgw
	api_gw -> api_one [color="#8b0000"]
	api_gw -> api_two [color="#8b0000"]
	api_two -> mainprinter [constraint=false, color="#8b0000"]
	api_one -> heating [constraint=false, color="#8b0000"]
	heating -> jboss_a
    applicationgw -> app_one
    applicationgw -> app_three
    applicationgw -> app_two
	mainprinter -> printer
	apps_one1 -> mainprinter [constraint=false]
    app_one -> apps_one1
    app_two -> apps_two1
    app_three -> apps_three1
    apps_two1 -> db2 [color="#8b0000"]
    apps_one1 -> db2 [color="#8b0000"]
    apps_three1 -> db2 [color="#8b0000"]
    apps_one1 -> db1 [color="#8b0000"]
    apps_three1 -> db1 [color="#8b0000"]
	appsa1 -> postcode [constraint=false]

    apps_one1 -> heating [color="#8b0000"]
}