Top Rank Node is not center aligned over some subgraphs

Hi,
I want to draw a graph showing the ISO 9001 structure as vertical and horizontal nodes.

I works almost, but there are four subgraphs under the node node “plan”. I want to make the node “Plan” as wide as the width of the four subgraphs in total. But when I increase the node width the node alignment starts after a value of approx. 60 to shift to right or left.

Here is a reduced sample to show the effect:

digraph "ISO 9001 - Orientierung am PDCA-Zyklus" {
	fontname="Arial,Helvetica,sans-serif"
	node [fontname="Arial,Helvetica,sans-serif"]
	edge [fontname="Arial,Helvetica,sans-serif"]
	graph [
		newrank = true,
		nodesep = 2.0,
		ranksep = 1.25,
		overlap = true,
		splines = false,
    	]
    	node [
    		fixedsize = true,
    		fontsize = 90,
    		height = 5.5,
    		shape = box,
    		style = "filled, setlinewidth(5), rounded",
    		width = 19
    	]
    	edge [
    		style = invis,
    	]
        subgraph Plan 
        {
    	node [color = "#22bb55"]
    	plan [
    		label = "Plan",
    		height = 2.5,
    		width = 82]
    		subgraph kontext { 
    	    margin = 1
    	    kontext4_ [
    		    label = "4\nKontext der Organisation"
    		  ]
            }
    		subgraph fuehrung {
    		    fuehrung5_ [
    			label = "5\nFührung"
    			]
    		}
    	    subgraph planung {
    	        planung6_ [
    			label = "6\nPlanung"
    			]
    	    }
    		subgraph unterstuetzung {
    		    unterstuetzung7_ [
    			label = "7\nUnterstützung"
    			]
    		}
    		plan -> kontext4_ 
    		plan -> fuehrung5_ 
    		plan -> planung6_ 
    		plan -> unterstuetzung7_
    	}
    	subgraph Do {
    		node [color = "#cc99aa"]
    		do [
    			label = "Do",
    			height = 2.5,
    	    ]
    	    subgraph betrieb {
    	        betrieb8_ [
		  	        label = "8\nBetrieb ",
	        	]
    	    }
    	    do -> betrieb8_
    	}
	}

How do I get the node “Plan” centered above the four subgraphs?

Thx Guenther

Though legal, your sizes were quite large (width=19 means 19 inches. Roughly .5 meters). Seemingly a size-related bug caused your problem.
Below is a modified version with heights, widths, and fontsize all divided by 5.

//
//
//  sizes were very large (though legal) (units are in inches)
//  divided heights, widths, fontsize by 5
//
//
digraph "ISO 9001 - Orientierung am PDCA-Zyklus" {
  fontname="Arial,Helvetica,sans-serif"
  node [fontname="Arial,Helvetica,sans-serif"]
  edge [fontname="Arial,Helvetica,sans-serif"]
  graph [
    //newrank = true,   // probably not necessary
    nodesep = 2.0,      // ok
    ranksep = 1.25,     // ok
    //overlap = true,   // ignored by dot
    //splines = false,  // not necessary, all edges are invis
  ]
  node [
    fixedsize = true,
    fontsize = 18   // 90,
    height = 1.1    // 5.5,
    shape = box,
    style = "filled, setlinewidth(5), rounded",
    width = 4       // 19
  ]
  edge [
    style = invis,
  ]
  subgraph Plan
  {
    node [color = "#22bb55"]
    plan [
      label = "Plan",
      height = .5  // 2.5,
      width = 16   // 82
      ]

    subgraph kontext {
      margin = 1       // ???
      kontext4_ [
        label = "4\nKontext der Organisation"
      ]
    }
    subgraph fuehrung {
      fuehrung5_ [
        label = "5\nFührung"
      ]
    }
    subgraph planung {
      planung6_ [
        label = "6\nPlanung"
      ]
    }
    subgraph unterstuetzung {
      unterstuetzung7_ [
        label = "7\nUnterstützung"
      ]
    }

    plan -> kontext4_
    plan -> fuehrung5_
    plan -> planung6_
    plan -> unterstuetzung7_
  }
  subgraph Do {
    node [color = "#cc99aa"]
    do [
        label = "Do",
        height = .5    // 2.5,
      ]
      subgraph betrieb {
      betrieb8_ [
        label = "8\nBetrieb ",
      ]
    }
    do -> betrieb8_
    }
}

Giving:

Hi Steve,

thx for your help. You are right: the dimensions are huge. This chart should fit on a wall poster, but I realized later that I don’t have to make it so large. It is rendered to svg and I can scale it to every size I wish to. I was just lazy to reduce.

But I don’t think this is the reason. If I divide also the nodesep by 5 (-> 0.4) I get the same odd result:

//
//
//  sizes were very large (though legal) (units are in inches)
//  divided heights, widths, fontsize by 5
//
//
digraph "ISO 9001 - Orientierung am PDCA-Zyklus" {
  fontname="Arial,Helvetica,sans-serif"
  node [fontname="Arial,Helvetica,sans-serif"]
  edge [fontname="Arial,Helvetica,sans-serif"]
  graph [
    //newrank = true,   // probably not necessary
    nodesep = 0.4,      // ok
    ranksep = 0.25,     // ok
    //overlap = true,   // ignored by dot
    //splines = false,  // not necessary, all edges are invis
  ]
  node [
    fixedsize = true,
    fontsize = 18   // 90,
    height = 1.1    // 5.5,
    shape = box,
    style = "filled, setlinewidth(5), rounded",
    width = 4       // 19
  ]
  edge [
    style = invis,
  ]
  subgraph Plan
  {
    node [color = "#22bb55"]
    plan [
      label = "Plan",
      height = .5  // 2.5,
      width = 17.2   // 4 * nodewidth + 3 * nodesep
      ]

    subgraph kontext {
      margin = 1       // ???
      kontext4_ [
        label = "4\nKontext der Organisation"
      ]
    }
    subgraph fuehrung {
      fuehrung5_ [
        label = "5\nFührung"
      ]
    }
    subgraph planung {
      planung6_ [
        label = "6\nPlanung"
      ]
    }
    subgraph unterstuetzung {
      unterstuetzung7_ [
        label = "7\nUnterstützung"
      ]
    }

    plan -> kontext4_
    plan -> fuehrung5_
    plan -> planung6_
    plan -> unterstuetzung7_
  }
  subgraph Do {
    node [color = "#cc99aa"]
    do [
        label = "Do",
        height = .5    // 2.5,
      ]
      subgraph betrieb {
      betrieb8_ [
        label = "8\nBetrieb ",
      ]
    }
    do -> betrieb8_
    }
}

It has to do with the width of the Plan node. I want to have it covering all of its next rank nodes. So the width should be (4 * nodewidth + 3 * nodesep). In this case a width of 17.2 is correct. If I use a width of 13 it shows the same result as your example. Going beyond 13 it starts to get asymmetrical.

The most irritating thing: if I comment out the last subgraph and reduce the width to 12.8 it works as expected …


//
//
//  sizes were very large (though legal) (units are in inches)
//  divided heights, widths, fontsize by 5
//
//
digraph "ISO 9001 - Orientierung am PDCA-Zyklus" {
  fontname="Arial,Helvetica,sans-serif"
  node [fontname="Arial,Helvetica,sans-serif"]
  edge [fontname="Arial,Helvetica,sans-serif"]
  graph [
    //newrank = true,   // probably not necessary
    nodesep = 0.4,      // ok
    ranksep = 0.25,     // ok
    //overlap = true,   // ignored by dot
    //splines = false,  // not necessary, all edges are invis
  ]
  node [
    fixedsize = true,
    fontsize = 18   // 90,
    height = 1.1    // 5.5,
    shape = box,
    style = "filled, setlinewidth(5), rounded",
    width = 4       // 19
  ]
  edge [
    style = invis,
  ]
  subgraph Plan
  {
    node [color = "#22bb55"]
    plan [
      label = "Plan",
      height = .5  // 2.5,
      width = 12.8   // 4 * nodewidth + 3 * nodesep
      ]

    subgraph kontext {
      margin = 1       // ???
      kontext4_ [
        label = "4\nKontext der Organisation"
      ]
    }
    subgraph fuehrung {
      fuehrung5_ [
        label = "5\nFührung"
      ]
    }
    subgraph planung {
      planung6_ [
        label = "6\nPlanung"
      ]
    }
    //subgraph unterstuetzung {
    //  unterstuetzung7_ [
    //    label = "7\nUnterstützung"
    //  ]
    //}

    plan -> kontext4_
    plan -> fuehrung5_
    plan -> planung6_
    //plan -> unterstuetzung7_
  }
  subgraph Do {
    node [color = "#cc99aa"]
    do [
        label = "Do",
        height = .5    // 2.5,
      ]
      subgraph betrieb {
      betrieb8_ [
        label = "8\nBetrieb ",
      ]
    }
    do -> betrieb8_
    }
}

I’m lost …

Not sure why the mis-alignment, but enclosing Plan in a cluster seems to work.
If not we can look at Osage.

digraph "ISO 9001 - Orientierung am PDCA-Zyklus" {
  fontname="Arial,Helvetica,sans-serif"
  node [fontname="Arial,Helvetica,sans-serif"]
  edge [fontname="Arial,Helvetica,sans-serif"]
  graph [
    //newrank = true,   // probably not necessary
    nodesep = 0.4,      // ok
    ranksep = 0.25,     // ok
    //overlap = true,   // ignored by dot
    //splines = false,  // not necessary, all edges are invis
  ]
  node [
    fixedsize = true,
    fontsize = 18   // 90,
    height = 1.1    // 5.5,
    shape = box,
    style = "filled, setlinewidth(5), rounded",
    width = 4       // 19
  ]
  edge [
    style = invis,
  ]
  subgraph clusterPlan {
  peripheries=0

  subgraph Plan
  {
    node [color = "#22bb55"]
    plan [
      label = "Plan",
      height = .5  // 2.5,
      width = 17.2   // 4 * nodewidth + 3 * nodesep
      ]

    subgraph kontext {
      margin = 1       // ???
      kontext4_ [
        label = "4\nKontext der Organisation"
      ]
    }
    subgraph fuehrung {
      fuehrung5_ [
        label = "5\nFührung"
      ]
    }
    subgraph planung {
      planung6_ [
        label = "6\nPlanung"
      ]
    }
    subgraph unterstuetzung {
      unterstuetzung7_ [
        label = "7\nUnterstützung"
      ]
    }

    plan -> kontext4_
    plan -> fuehrung5_
    plan -> planung6_
    plan -> unterstuetzung7_
  }
  }
  subgraph Do {
    node [color = "#cc99aa"]
    do [
        label = "Do",
        height = .5    // 2.5,
      ]
      subgraph betrieb {
      betrieb8_ [
        label = "8\nBetrieb ",
      ]
    }
    do -> betrieb8_
    }
}

I’d like to suggest an alternate approach. When creating these types of diagrams, or domain maps, taxonomies, etc. I feel the osage layout is superior to dot for this use case. Osage will allow you to nest clusters, control top/bottom/left/right alignment, and control the order of the node placement.

Unfortunately most people don’t know how to use osage. osage draws the graph recursively. At each level, there will be a collection of nodes and a collection of cluster subgraphs. The internals of each cluster subgraph are laid out, then the cluster subgraphs and nodes at the current level are positioned relative to each other, treating each cluster subgraph as a node.

The secret is to use packmode attributes to describe how the clusters should be nested, and sortv attributes to specify the order in which clusters and nodes should be emitted.

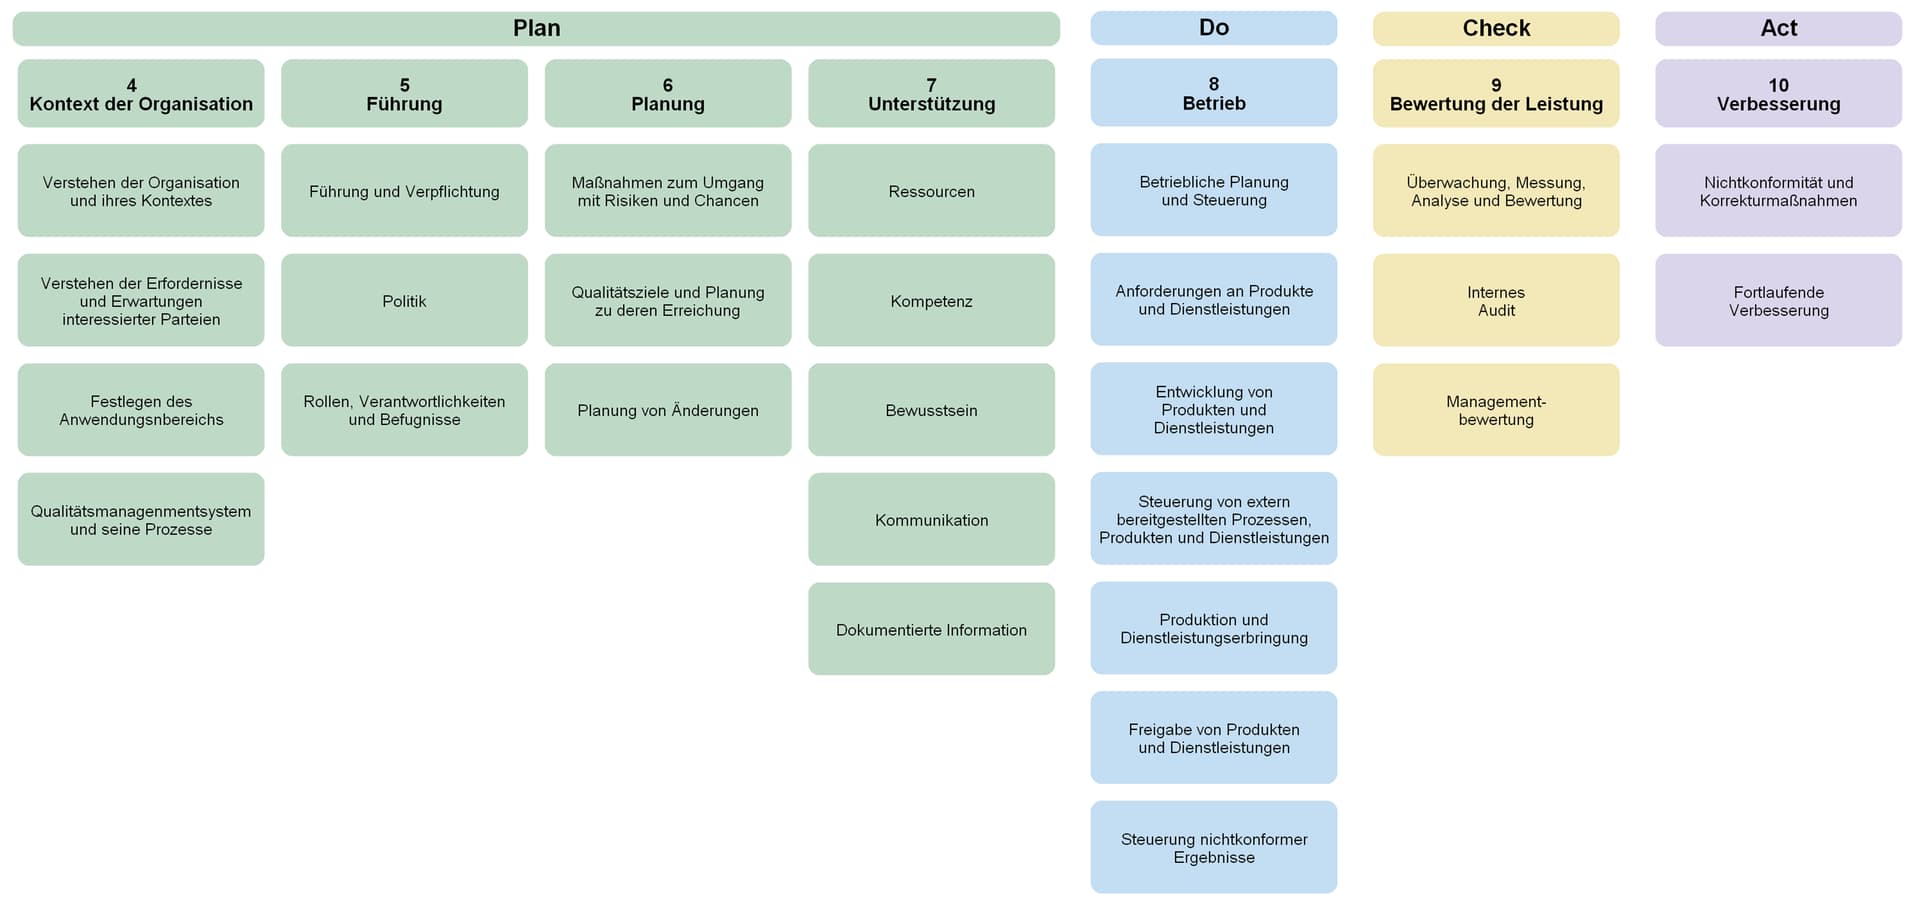
I’m assuming you are trying to create a diagram similar to this one I found through a Google image search:

Source: https://images.app.goo.gl/8Tsu7q3TVb1Qgta88

Using the osage layout instead of dot allowed me to create a very similar diagram, with full-width headings which you desire:

The source for the diagram is as follows:

strict digraph "main"
{
    layout=osage;
    splines=ortho;
    pad="0.5,0.5"
    node[ shape=rect height=0.75 width=1.25 fixedsize=True fillcolor=White fontname=Arial fontsize=10 style="filled,rounded" penwidth=0.5 label="" ];
    edge[ fontname=Arial fontsize=10 arrowsize=0.5 ];
    subgraph cluster_1 {  packmode=array_rtu4 color=transparent label=""
        subgraph cluster_2 {  sortv=1000 packmode=array_tu1 label=""
            subgraph cluster_3 {  sortv=1100 packmode=array_tu1 label=""
                plan [ shape=rect height=0.1875 width=5.5 fillcolor=LightYellow penwidth=0.5 fontname=Arial fontsize=10 style="filled" labelloc=top label=<<b>PLAN</b>> ];
            }
            subgraph cluster_4 {  sortv=1200 packmode=array_rtu3 label=""
                subgraph cluster_5 {  sortv=1210 packmode=array_rtru1 label=""
                    4 [ shape=rect height=0.75 width=1.75 fillcolor=LightYellow penwidth=0.5 fontname=Arial fontsize=10 style="rounded,filled" labelloc=top pad="0.25,0.25" sortv=0 label=<<u><b>Clause 4</b></u><br/><br/>Context of the <br/>organization> ];
                    4.1 [ sortv=1 label="4.1 Understanding\nthe organization\nand its context" ];
                    4.2 [ sortv=2 label="4.2 Understanding\nthe needs and\nexpectations\nof interested parties" ];
                    4.3 [ sortv=3 label="4.3 Determining the\nscope of the QMS" ];
                    4.4 [ sortv=4 label="4.4 Quality\nmanagement\nsystem & its\nprocesses" ];
                }
                subgraph cluster_6 {  sortv=1220 packmode=array_rtu1 label=""
                    5 [ shape=rect height=0.75 width=1.75 fillcolor=LightYellow penwidth=0.5 fontname=Arial fontsize=10 style="rounded,filled" labelloc=top pad="0.25,0.25" sortv=0 label=<<u><b>Clause 5</b></u><br/><br/>Leadership> ];
                    5.1 [ sortv=1 label="5.1 Leadership and\ncommitment" ];
                    5.2 [ sortv=2 label="5.2 Quality Policy" ];
                    5.3 [ sortv=3 label="5.3 Organizational\nroles,\nresponsibilities and\nauthorities" ];
                }
                subgraph cluster_7 {  sortv=1230 packmode=array_rtu1 label=""
                    6 [ shape=rect height=0.75 width=1.75 fillcolor=LightYellow penwidth=0.5 fontname=Arial fontsize=10 style="rounded,filled" labelloc=top pad="0.25,0.25" sortv=0 label=<<u><b>Clause 6</b></u><br/><br/>Planning> ];
                    6.1 [ sortv=1 label="6.1 Actions to\naddress risks and\nopportunities" ];
                    6.2 [ sortv=2 label="6.2 Quality\nobjectives and\nplanning to achieve\nthem" ];
                    6.3 [ sortv=3 label="6.3 Planning of\nchanges" ];
                }
            }
        }
        subgraph cluster_8 {  sortv=2000 packmode=array_tu1 label=""
            subgraph cluster_9 {  sortv=2100 packmode=array_tu1 label=""
                do [ shape=rect height=0.1875 width=3.55 fillcolor=LightGreen penwidth=0.5 fontname=Arial fontsize=10 style="filled" labelloc=top label=<<b>DO</b>> ];
            }
            subgraph cluster_10 {  sortv=2200 packmode=array_rtu2 label=""
                subgraph cluster_11 {  sortv=2210 packmode=array_rtu1 label=""
                    7 [ shape=rect height=0.75 width=1.75 fillcolor=LightGreen penwidth=0.5 fontname=Arial fontsize=10 style="rounded,filled" labelloc=top pad="0.25,0.25" sortv=0 label=<<u><b>Clause 7</b></u><br/><br/>Support> ];
                    7.1 [ sortv=1 label="7.1 Resources" ];
                    7.2 [ sortv=2 label="7.2 Competence" ];
                    7.3 [ sortv=3 label="7.3 Awareness" ];
                    7.4 [ sortv=4 label="7.4 Communication" ];
                    7.5 [ sortv=5 label="7.5 Documented\nInformation" ];
                }
                subgraph cluster_12 {  sortv=2220 packmode=array_rtu1 label=""
                    8 [ shape=rect height=0.75 width=1.75 fillcolor=LightGreen penwidth=0.5 fontname=Arial fontsize=10 style="rounded,filled" labelloc=top pad="0.25,0.25" label=<<u><b>Clause 8</b></u><br/><br/>Operation> ];
                    8.1 [ sortv=1 label="8.1 Operational\nplanning and\ncontrol" ];
                    8.2 [ sortv=2 label="8.2 Requirements\nfor products &\nservices" ];
                    8.3 [ sortv=3 label="8.3 Design & \nDevelopment of\nproducts & services" ];
                    8.4 [ sortv=4 label="8.4 Control of\nexternally provided\nprocesses, products\nand services" ];
                    8.5 [ sortv=5 label="8.5 Production and\nservice provision" ];
                    8.6 [ sortv=6 label="8.6 Release of\nproducts and\nservices" ];
                    8.7 [ sortv=7 label="8.7 Control of\nnonconformity\nproducts" ];
                }
            }
        }
        subgraph cluster_13 {  sortv=3000 packmode=array_rtu1 label=""
            subgraph cluster_14 {  sortv=3100 packmode=array_rtu1 label=""
                check [ shape=rect height=0.1875 width=1.75 fillcolor=LightBlue penwidth=0.5 fontname=Arial fontsize=10 style="filled" labelloc=top label=<<b>CHECK</b>> ];
            }
            subgraph cluster_15 {  sortv=3200 packmode=array_rtu1 label=""
                subgraph cluster_16 {  sortv=3210 packmode=array_rtu1 label=""
                    9 [ shape=rect height=0.75 width=1.75 fillcolor=LightBlue penwidth=0.5 fontname=Arial fontsize=10 style="rounded,filled" labelloc=top pad="0.25,0.25" sortv=0 label=<<u><b>Clause 9</b></u><br/><br/>Performance<br/>Evaluation> ];
                    9.1 [ sortv=1 label="9.1 Monitoring,\nmeasurement,\nanalysis and\nevaluation" ];
                    9.2 [ sortv=2 label="9.2 Internal Audit" ];
                    9.3 [ sortv=3 label="9.3 Management\nReview" ];
                }
            }
        }
        subgraph cluster_17 {  sortv=4000 packmode=array_rtu1 label=""
            subgraph cluster_18 {  sortv=4100 packmode=array_rtu1 label=""
                act [ shape=rect height=0.1875 width=1.75 fillcolor=Mistyrose penwidth=0.5 fontname=Arial fontsize=10 style="filled" labelloc=top label=<<b>ACT</b>> ];
            }
            subgraph cluster_19 {  sortv=4200 packmode=array_rtu1 label=""
                subgraph cluster_20 {  sortv=4210 packmode=array_rtu1 label=""
                    10 [ shape=rect height=0.75 width=1.75 fillcolor=Mistyrose penwidth=0.5 fontname=Arial fontsize=10 style="rounded,filled" labelloc=top pad="0.25,0.25" sortv=0 label=<<u><b>Clause 10</b></u><br/><br/>Improvement> ];
                    10.1 [ sortv=1 label="10.1 General" ];
                    10.2 [ sortv=2 label="10.2 Nonconformity\nand corrective\nactions" ];
                    10.3 [ sortv=3 label="10.3 Continual\nimprovement" ];
                }
            }
        }
    }
    edge[ fontname=Arial fontsize=10 arrowsize=0.5 ];
    4 -> 5;
    5 -> 6;
    6 -> 7;
    7 -> 8;
    8 -> 9;
    9 -> 10;
    10 -> 4;
    edge[ color="CadetBlue" penwidth=0.5 dir=none fontname=Arial fontsize=10 ];
    4 -> 4.1;
    4 -> 4.2;
    4 -> 4.3;
    4 -> 4.4;
    5 -> 5.1;
    5 -> 5.2;
    5 -> 5.3;
    6 -> 6.1;
    6 -> 6.2;
    6 -> 6.3;
    7 -> 7.1;
    7 -> 7.2;
    7 -> 7.3;
    7 -> 7.4;
    7 -> 7.5;
    8 -> 8.1;
    8 -> 8.2;
    8 -> 8.3;
    8 -> 8.4;
    8 -> 8.5;
    8 -> 8.6;
    8 -> 8.7;
    9 -> 9.1;
    9 -> 9.2;
    9 -> 9.3;
    10 -> 10.1;
    10 -> 10.2;
    10 -> 10.3;
}

iso9001.gv (7.3 KB)

Nesting clusters can be a little confusing. Each time you wish to change the number of columns you must create another cluster with a new packmode attribute. Inside that cluster can be more clusters, or just nodes. sortv values always refer the the most recent packmode in scope.

Here is the same diagram altered to show the cluster borders, and the packmode and sortv values used:

packmode=array Tutorial

How do packmode=array values affect the output?

The mode array(_flag)?(%d)? indicates that the components (clusters or nodes) should be packed at the graph level into an array of graphs. By default, the components are in row-major order, with the number of columns roughly the square root of the number of components.

The integer suffix specifies the number of columns for row-major. Thus, the mode array_r4 indicates array packing, with 4 columns per row, starting in the upper left and going across the first row, then to the second row, etc., until all components are used.

If a graph is smaller than the array cell it occupies, it is centered (left, right, top, and bottom) by default. The optional flags may contain t, b, l, or r, indicating that the graphs should be aligned along the top, bottom, left or right, respectively. The flags may also be combined such as tl for top left, tr for top right, bl for bottom left, or br for bottom right.

If the optional flags contains u, the order of elements is determined by user-supplied values. Each component can specify its sort value by a non-negative integer using the sortv attribute. Components are inserted in order, starting with the one with the smallest sort value. If no sort value is specified, zero is used.

Here are some examples:

Example 1: Default Behavior

packmode=array

Notice that the components are packed roughly in the square root of the 5 components.

image

Example 2: Align Right

packmode=array_r is causing right alignment of node 4.4 with the larger node above it.

image

Example 3: Specify Sort Order

packmode=array_ru says to use the sortv attribute to place the nodes in numerical order specified.

image

Example 4: One Column, Sort Order

packmode=array_u1 says to use one column, and insert the components in the order specified by sortv. The components are centered by default.

image

Example 5: One Column, Sort Order Specified, Right-aligned

packmode=array_ru1 says to use one column.

image

Example 6: One Column, Sort Order Specified, Left-aligned

packmode=array_lu1 says to use one column, and left-align the contents of the column.

image

Example 7: Three Columns, Sort Order Specified

packmode=array_ru3 says to have 3 columns. Note that each column is a transparent cluster. By default the clusters are aligned in the center top-to-bottom.

image

Example 8: Three Columns, Sort Order Specified, Top-aligned

packmode=array_rtu3 says to have 3 columns, and align the contents top-to-bottom.

image

Example 9: Three Columns, Sort Order Specified, Bottom-aligned

Likewise, we can align the contents to the bottom of the cluster with packmode=array_rbu3

image

3 Likes

Thank you so much - It works as expected!

Here is my complete diagram in case someone searches for a PDCA clustered diagram of ISO 9001:

digraph "ISO 9001 - Orientierung am PDCA-Zyklus" {
	fontname="Arial,Helvetica,sans-serif"
	node [fontname="Arial,Helvetica,sans-serif"]
	graph [
		nodesep = 0.4,
		ranksep = 0.275,
	]
	node [
		fixedsize = true,
		fontsize = 19,
		height = 1.25,
		shape = box,
		style = "filled, setlinewidth(5), rounded",
		width = 4
	]
	edge [
	    style = invis,
	]
	subgraph clusterPlan {
        peripheries = 0
      	subgraph Plan {
      		node [color = "#bfd9c7"]
      		plan [
      			label = "Plan",
      			fontsize = 27,
      			height = 0.7,
      			width = 17.2]
      		kontext4_ [
      			label = "4\nKontext der Organisation",
      			fontsize = 23,
      		]
      		fuehrung5_ [
      			label = "5\nFührung",
      			fontsize = 23,
      		]
      		planung6_ [
      			label = "6\nPlanung",
      			fontsize = 23,
      		]
      		unterstuetzung7_ [
      			label = "7\nUnterstützung",
      			fontsize = 23,
      		]
      		plan -> kontext4_
      		kontext41_ [
      			label = "Verstehen der Organisation\nund ihres Kontextes",
      		]
      		kontext42_ [
      			label = "Verstehen der Erfordernisse\nund Erwartungen\ninteressierter Parteien",
      		]
      		kontext43_ [
      			label = "Festlegen des\nAnwendungsnbereichs",
      		]
      		kontext44_ [
      			label = "Qualitätsmanagenmentsystem\nund seine Prozesse",
      		]
      		kontext4_ -> kontext41_
      		kontext41_ -> kontext42_
      		kontext42_ -> kontext43_
      		kontext43_ -> kontext44_
      		plan -> fuehrung5_
      		fuehrung51_ [
      			label = "Führung und Verpflichtung",
      		]
      		fuehrung52_ [
      			label = "Politik",
      		]
      		fuehrung53_ [
      			label = "Rollen, Verantwortlichkeiten\nund Befugnisse",
      		]
      		fuehrung5_ -> fuehrung51_
      		fuehrung51_ -> fuehrung52_
      		fuehrung52_ -> fuehrung53_
      		plan -> planung6_
      		planung61_ [
      			label = "Maßnahmen zum Umgang\nmit Risiken und Chancen",
      		]
      		planung62_ [
      			label = "Qualitätsziele und Planung\nzu deren Erreichung",
      		]
      		planung63_ [
      			label = "Planung von Änderungen",
      		]
      		planung6_ -> planung61_
      		planung61_ -> planung62_
      		planung62_ -> planung63_
      		plan -> unterstuetzung7_
      		unterstuetzung71_ [
      			label = "Ressourcen",
      		]
      		unterstuetzung72_ [
      			label = "Kompetenz",
      		]
      		unterstuetzung73_ [
      			label = "Bewusstsein",
      		]
      		unterstuetzung74_ [
      			label = "Kommunikation",
      		]
      		unterstuetzung75_ [
      			label = "Dokumentierte Information",
      		]
      		unterstuetzung7_ -> unterstuetzung71_
      		unterstuetzung71_ -> unterstuetzung72_
      		unterstuetzung72_ -> unterstuetzung73_
      		unterstuetzung73_ -> unterstuetzung74_
      		unterstuetzung74_ -> unterstuetzung75_
      	}
	}
	subgraph Do {
		node [color = "#c3ddf2"]
		do [
			label = "Do",
			fontsize = 27,
			height = 0.7,
	    ]
		betrieb8_ [
			label = "8\nBetrieb ",
			fontsize = 23,
		]
		do -> betrieb8_
		betrieb81_ [
			label = "Betriebliche Planung\nund Steuerung",
		]
		betrieb82_ [
			label = "Anforderungen an Produkte\nund Dienstleistungen",
		]
		betrieb83_ [
			label = "Entwicklung von\nProdukten und\nDienstleistungen",
		]
		betrieb84_ [
			label = "Steuerung von extern\nbereitgestellten Prozessen,\nProdukten und Dienstleistungen",
		]
		betrieb85_ [
			label = "Produktion und\nDienstleistungserbringung",
		]
		betrieb86_ [
			label = "Freigabe von Produkten\nund Dienstleistungen",
		]
		betrieb87_ [
			label = "Steuerung nichtkonformer\nErgebnisse",
		]
		betrieb8_ -> betrieb81_
		betrieb81_ -> betrieb82_
		betrieb82_ -> betrieb83_
		betrieb83_ -> betrieb84_
		betrieb84_ -> betrieb85_
		betrieb85_ -> betrieb86_
		betrieb86_ -> betrieb87_
	}
	subgraph Check {
		node [color = "#f3e8b8"]
		check [
			label = "Check",
			height = 0.7,
			fontsize = 27,
	    ]
		check9_ [
			label = "9\nBewertung der Leistung",
			fontsize = 23,
		]
		check -> check9_
		check91_ [
			label = "Überwachung, Messung,\nAnalyse und Bewertung",
		]
		check92_ [
			label = "Internes\nAudit",
		]
		check93_ [
			label = "Management-\nbewertung",
		]
		check9_ -> check91_
		check91_ -> check92_
		check92_ -> check93_
	}
	subgraph Act {
		node [color = "#dad5ea"]
		act [
			label = "Act",
			fontsize = 27,
			height = 0.7,
	    ]
		act10_ [
			label = "10\nVerbesserung",
			fontsize = 23,
		]
		act -> act10_
		act102_ [
			label = "Nichtkonformität und\nKorrekturmaßnahmen",
		]
		act103_ [
			label = "Fortlaufende\nVerbesserung",
		]
		act10_ -> act102_
		act102_ -> act103_
	}
}

Again - thanks a lot for your help!

Wow!

You were right about the diagram I was looking for.

I’m quiet a novice in using graphviz. I know only dot and neato a bit, but I will look for sure into your explanations. Osage looks really promising and I got some more diagrams to draw. Next one will be with osage.

Thanks for spending so much time in writing this very elaborate explanation. I still have to work out some details …

Your diagram looks great!

It inspired me to update my osage tutorial. I’ve refactored my osage-layout diagram to look like your diagram. When you view the source you can see the differences in approach.

My diagram using the osage layout appears as follows:

It was created from this source:

strict digraph "main"
{
    layout=osage;
    splines=ortho;
    pad="0.5,0.5"
    node[ shape=rect height=0.5 width=2 penwidth=0.5 fontname=Arial fontsize=10 style="rounded,filled" fixedsize=true label="" ];
    subgraph cluster_1 {  packmode=array_tu4 color=transparent label=""
        node[ color="#bfd9c7" label="" ];
        subgraph cluster_2 {  sortv=1000 packmode=array_u1 label=""
            subgraph cluster_3 {  sortv=1100 label=""
                heading_plan [ height=0.25 width=8.3125 label="Plan" ];
            }
            subgraph cluster_4 {  sortv=1200 packmode=array_tu4 label=""
                subgraph cluster_5 {  sortv=1210 packmode=array_u1 label=""
                    40 [ sortv=1211 label="4\nKontext der Organisation" ];
                    41 [ sortv=1212 label="Verstehen der Organisation\nund ihres Kontextes" ];
                    42 [ sortv=1213 label="Verstehen der Erfordernisse\nund Erwartungen\ninteressierter Parteien" ];
                    43 [ sortv=1214 label="Festlegen des\nAnwendungsnbereichs" ];
                    44 [ sortv=1215 label="Qualitätsmanagenmentsystem\nund seine Prozesse" ];
                }
                subgraph cluster_6 {  sortv=1220 packmode=array_u1 label=""
                    50 [ sortv=1221 label="5\nFührung" ];
                    51 [ sortv=1222 label="Führung und Verpflichtung" ];
                    52 [ sortv=1223 label="Politik" ];
                    53 [ sortv=1224 label="Rollen, Verantwortlichkeiten\nund Befugnisse" ];
                }
                subgraph cluster_7 {  sortv=1230 packmode=array_u1 label=""
                    60 [ sortv=1231 label="6\nPlanung" ];
                    61 [ sortv=1232 label="Maßnahmen zum Umgang\nmit Risiken und Chancen" ];
                    62 [ sortv=1233 label="Qualitätsziele und Planung\nzu deren Erreichung" ];
                    63 [ sortv=1234 label="Planung von Änderungen" ];
                }
                subgraph cluster_8 {  sortv=1240 packmode=array_u1 label=""
                    70 [ sortv=1241 label="7\nUnterstützung" ];
                    71 [ sortv=1242 label="Ressourcen" ];
                    72 [ sortv=1243 label="Kompetenz" ];
                    73 [ sortv=1244 label="Bewusstsein" ];
                    74 [ sortv=1245 label="Kommunikation" ];
                    75 [ sortv=1246 label="Dokumentierte Information" ];
                }
            }
        }
        node[ color="#c3ddf2" label="" ];
        subgraph cluster_9 {  sortv=2000 packmode=array_u1 label=""
            subgraph cluster_10 {  sortv=2100 label=""
                heading_do [ height=0.25 label="Do" ];
            }
            subgraph cluster_11 {  sortv=2200 packmode=array_u1 label=""
                80 [ sortv=2201 label="8\nBetrieb" ];
                81 [ sortv=2202 label="Betriebliche Planung\nund Steuerung" ];
                82 [ sortv=2203 label="Anforderungen an Produkte\nund Dienstleistungen" ];
                83 [ sortv=2204 label="Entwicklung von\nProdukten und\nDienstleistungen" ];
                84 [ sortv=2205 label="Steuerung von extern\nbereitgestellten Prozessen,\nProdukten und Dienstleistungen" ];
                85 [ sortv=2206 label="Produktion und\nDienstleistungserbringung" ];
                86 [ sortv=2207 label="Freigabe von Produkten\nund Dienstleistungen" ];
                87 [ sortv=2208 label="Steuerung nichtkonformer\nErgebnisse" ];
            }
        }
        node[ color="#f3e8b8" label="" ];
        subgraph cluster_12 {  sortv=3000 packmode=array_u1 label=""
            subgraph cluster_13 {  sortv=3100 label=""
                heading_check [ height=0.25 label="Check" ];
            }
            subgraph cluster_14 {  sortv=3200 packmode=array_u1 label=""
                90 [ sortv=3201 label="9\nBewertung der Leistung" ];
                91 [ sortv=3202 label="Überwachung, Messung,\nAnalyse und Bewertung" ];
                92 [ sortv=3203 label="Internes\nAudit" ];
                93 [ sortv=3204 label="Management-\nbewertung" ];
            }
        }
        node[ color="#dad5ea" label="" ];
        subgraph cluster_15 {  sortv=4000 packmode=array_u1 label=""
            subgraph cluster_16 {  sortv=4100 label=""
                heading_act [ height=0.25 label="Act" ];
            }
            subgraph cluster_17 {  sortv=4200 packmode=array_u1 label=""
                100 [ sortv=4201 label="10\nVerbesserung" ];
                101 [ sortv=4202 label="Nichtkonformität und\nKorrekturmaßnahmen" ];
                102 [ sortv=4203 label="Fortlaufende\nVerbesserung" ];
            }
        }
    }
}

FWIW, I created these examples easily using Excel to Graphviz as my Graphviz IDE.

Jeff, this is amazing! Thanks a lot!

I played a little bit and modified my diagram to match the dot version. The osage code is much more structured and much easier to read. However as nodesep and ranksep are not working in osage it is more difficult to set the spacing of the nodes only by using pack=“x”. But you can not have it all.

Here is my result:

Created by this code:

strict digraph "ISO 9001 - Orientierung am PDCA-Zyklus"
{
  layout=osage;
  fontname="Arial,Helvetica,sans-serif"
	node [fontname="Arial,Helvetica,sans-serif"]
  splines=ortho;
  pad="0,0";
	pack="false"
    node[ shape=rect height=1.25 width=4 penwidth=2 fontname=Arial fontsize=19 style="rounded, filled" fixedsize=true label="" ];
    subgraph cluster_1 {  packmode=array_tu4 color=transparent label=""
        node[ color="#bfd9c7" fillcolor="#bfd9c7" label="" ];
        subgraph cluster_2 {  sortv=1000 packmode=array_tu1 label="" pack="false"
            subgraph cluster_3 {  sortv=1100 label="" pack="false"
                heading_plan [ height=0.55 width=17.0 fontsize = 27 label=<<B>Plan</B>> ];
            }
            subgraph cluster_4 {  sortv=1200 packmode=array_tu4 label="" pack="false"
                subgraph cluster_5 {  sortv=1210 packmode=array_tu1 label="" pack="20"
                    40 [ sortv=1211 height=1.1 fontsize = 22 label=<<B>4&emsp;<BR/>Kontext der Organisation</B>> ];
                    41 [ sortv=1212 label="Verstehen der Organisation\nund ihres Kontextes" ];
                    42 [ sortv=1213 label="Verstehen der Erfordernisse\nund Erwartungen\ninteressierter Parteien" ];
                    43 [ sortv=1214 label="Festlegen des\nAnwendungsnbereichs" ];
                    44 [ sortv=1215 label="Qualitätsmanagenmentsystem\nund seine Prozesse" ];
                }
                subgraph cluster_6 {  sortv=1220 packmode=array_tu1 label="" pack="20"
                    50 [ sortv=1221 height=1.1 fontsize = 22 label=<<B>5<BR/>Führung</B>> ];
                    51 [ sortv=1222 label="Führung und Verpflichtung" ];
                    52 [ sortv=1223 label="Politik" ];
                    53 [ sortv=1224 label="Rollen, Verantwortlichkeiten\nund Befugnisse" ];
                }
                subgraph cluster_7 {  sortv=1230 packmode=array_tu1 label="" pack="20"
                    60 [ sortv=1231 height=1.1 fontsize = 22 label=<<B>6<BR/>Planung</B>> ];
                    61 [ sortv=1232 label="Maßnahmen zum Umgang\nmit Risiken und Chancen" ];
                    62 [ sortv=1233 label="Qualitätsziele und Planung\nzu deren Erreichung" ];
                    63 [ sortv=1234 label="Planung von Änderungen" ];
                }
                subgraph cluster_8 {  sortv=1240 packmode=array_tu1 label=""  pack="20"
                    70 [ sortv=1241 height=1.1 fontsize = 22 label=<<B>7<BR/>Unterstützung</B>> ];
                    71 [ sortv=1242 label="Ressourcen" ];
                    72 [ sortv=1243 label="Kompetenz" ];
                    73 [ sortv=1244 label="Bewusstsein" ];
                    74 [ sortv=1245 label="Kommunikation" ];
                    75 [ sortv=1246 label="Dokumentierte Information" ];
                }
            }
        }
        node[ color = "#c3ddf2"  fillcolor = "#c3ddf2" label="" ];
        subgraph cluster_9 {  sortv=2000 packmode=array_tu1 label="" pack="6"
                subgraph cluster_10 {  sortv=2100 label="" pack="false"
                    heading_do [ height=0.55 fontsize = 27 label=<<B>Do</B>> ];
                }
                subgraph cluster_11 {  sortv=2200 packmode=array_tu1 label="" pack="20"
                    80 [ sortv=2201 height=1.1 fontsize = 22 label=<<B>8<BR/>Betrieb</B>> ];
                    81 [ sortv=2202 label="Betriebliche Planung\nund Steuerung" ];
                    82 [ sortv=2203 label="Anforderungen an Produkte\nund Dienstleistungen" ];
                    83 [ sortv=2204 label="Entwicklung von\nProdukten und\nDienstleistungen" ];
                    84 [ sortv=2205 label="Steuerung von extern\nbereitgestellten Prozessen,\nProdukten und Dienstleistungen" ];
                    85 [ sortv=2206 label="Produktion und\nDienstleistungserbringung" ];
                    86 [ sortv=2207 label="Freigabe von Produkten\nund Dienstleistungen" ];
                    87 [ sortv=2208 label="Steuerung nichtkonformer\nErgebnisse" ];
                }
        }
        node[ color="#f3e8b8" fillcolor="#f3e8b8" label="" ];
        subgraph cluster_12 {  sortv=3000 packmode=array_tu1 label="" pack="6"
            subgraph cluster_13 {  sortv=3100 label="" pack="false"
                heading_check [ height=0.55 fontsize = 27 label=<<B>Check</B>> ];
            }
            subgraph cluster_14 {  sortv=3200 packmode=array_tu1 label="" pack="20"
                90 [ sortv=3201 height=1.1 fontsize = 22 label=<<B>9<BR/>Bewertung der Leistung</B>> ];
                91 [ sortv=3202 label="Überwachung, Messung,\nAnalyse und Bewertung" ];
                92 [ sortv=3203 label="Internes\nAudit" ];
                93 [ sortv=3204 label="Management-\nbewertung" ];
            }
        }
        node[ color="#dad5ea" fillcolor="#dad5ea" label="" ];
        subgraph cluster_15 {  sortv=4000 packmode=array_tu1 label="" pack="6"
            subgraph cluster_16 {  sortv=4100 label="" pack="false"
                heading_act [ height=0.55 fontsize = 27 label=<<B>Act</B>> ];
            }
            subgraph cluster_17 {  sortv=4200 packmode=array_tu1 label="" pack="20"
                100 [ sortv=4201 height=1.1 fontsize = 22 label=<<B>10<BR/>Verbesserung</B>> ];
                101 [ sortv=4202 label="Nichtkonformität und\nKorrekturmaßnahmen" ];
                102 [ sortv=4203 label="Fortlaufende\nVerbesserung" ];
            }
        }
    }
}
  

The gap between “plan” and “do” is still a tiny bit larger than the the other ones, but it looks o.k.

I had to add an &emsp; to the 4 at the label “4 Kontext …”, because the line-height is too small and the “4” and the “O” from organisation were almost touching.

Is there an attribute to increase line-spacing? HTML-code like style="lineheight:1.2em" does not work.

A couple of ways to get more control over the text placement:

  • Use another program (maybe Inkscape?) to create each node, and all the text, as an SVG image and include each image in the Graphviz source (image | Graphviz). There are many other programs that are better at creating and positioning text.
  • Use HTML-like records (Node Shapes | Graphviz) in your nodes. While not “real” HTML, that will give more control over line spacing.

Wow, you have a great eye for detail. I’m impressed!

I believe the reason for the extra gap between “plan” and “do” is because there is a cluster present in “Plan” which is required to define the 4 columns, which is not present in “Do”, “Check”, or “Act”.

I took your source and added pen colors to the clusters. Each color represents the same region in the four areas. The red region in “Plan” is the additional cluster.

If we zoom in, we see:

image

So the red cluster is adding (red penwidth + white penwidth ) units to the top, bottom, left, and right sides of the plan area, and hence making a slightly larger gap between “Plan” and “Do”.

You actually compensate for it in the heading clusters. In the Plan cluster you specify pack=false and in the Do, Check, and Act clusters you specify pack=6.

image

As you can see, you end up with a slightly larger white margin between the dark green and cyan borders, so Plan is actually ever so slightly out of vertical alignment with Do, Check, and Act. :wink:

To make everything equal, I changed the pack=6 statements to pack=false for the Do, Check, and Act headers. Next I set pack=0 on the cluster_4 { sortv=1200 line, which makes the red cluster disappear from the output. I need to research why pack=0 behaves differently than pack=false, or penwidth=0.

Now the diagram appears as:

Here is the graph with the cluster colors removed:

Here is the modified source code:

strict digraph "ISO 9001 - Orientierung am PDCA-Zyklus"
{
    layout=osage;
    splines=ortho;
    
    node[ fontname="Arial,Helvetica,sans-serif" label="" ];
    pad="0,0"
    node[ shape=rect height=1.5 width=4 penwidth=0.5 fontname=Arial fontsize=19 style="rounded,filled" fixedsize=true label="" ];
    pack="false"
    subgraph cluster_1 {  packmode=array_tu4 color=transparent pack=18 label=""
        node[ color="#bfd9c7" label="" ];
        subgraph cluster_2 {  sortv=1000 packmode=array_u1 pack=false label=""
            subgraph cluster_3 {  sortv=1100 pack=false label=""
                heading_plan [ height=0.55 width=17.0 fontsize = 27 label=<<B>Plan</B>> ];
            }
            subgraph cluster_4 {  sortv=1200 packmode=array_tu4 pack=0 label=""
                subgraph cluster_5 {  sortv=1210 packmode=array_tu1  pack=20 label=""
                    40 [ sortv=1211 height=1.1 fontsize = 22 label=<<B>4&emsp;<BR/>Kontext der Organisation</B>> ];
                    41 [ sortv=1212 label="Verstehen der Organisation\nund ihres Kontextes" ];
                    42 [ sortv=1213 label="Verstehen der Erfordernisse\nund Erwartungen\ninteressierter Parteien" ];
                    43 [ sortv=1214 label="Festlegen des\nAnwendungsnbereichs" ];
                    44 [ sortv=1215 label="Qualitätsmanagenmentsystem\nund seine Prozesse" ];
                }
                subgraph cluster_6 {  sortv=1220 packmode=array_tu1 pack=20 label=""
                    50 [ sortv=1221 height=1.1 fontsize = 22 label=<<B>5<BR/>Führung</B>> ];
                    51 [ sortv=1222 label="Führung und Verpflichtung" ];
                    52 [ sortv=1223 label="Politik" ];
                    53 [ sortv=1224 label="Rollen, Verantwortlichkeiten\nund Befugnisse" ];
                }
                subgraph cluster_7 {  sortv=1230 packmode=array_tu1 pack=20 label=""
                    60 [ sortv=1231 height=1.1 fontsize = 22 label=<<B>6<BR/>Planung</B>> ];
                    61 [ sortv=1232 label="Maßnahmen zum Umgang\nmit Risiken und Chancen" ];
                    62 [ sortv=1233 label="Qualitätsziele und Planung\nzu deren Erreichung" ];
                    63 [ sortv=1234 label="Planung von Änderungen" ];
                }
                subgraph cluster_8 {  sortv=1240 packmode=array_tu1 pack=20 label=""
                    70 [ sortv=1241 height=1.1 fontsize = 22 label=<<B>7<BR/>Unterstützung</B>> ];
                    71 [ sortv=1242 label="Ressourcen" ];
                    72 [ sortv=1243 label="Kompetenz" ];
                    73 [ sortv=1244 label="Bewusstsein" ];
                    74 [ sortv=1245 label="Kommunikation" ];
                    75 [ sortv=1246 label="Dokumentierte Information" ];
                }
            }
        }
        node[ color="#c3ddf2" label="" ];
        subgraph cluster_9 {  sortv=2000 packmode=array_u1 pack=false label=""
            subgraph cluster_10 {  sortv=2100 pack=false label=""
                heading_do [ height=0.55 fontsize = 27 label=<<B>Do</B>> ];
            }
            subgraph cluster_11 {  sortv=2200 packmode=array_tu1 pack=20 label=""
                80 [ sortv=2201 height=1.1 fontsize=22 label=<<B>8<BR/>Betrieb</B>> ];
                81 [ sortv=2202 label="Betriebliche Planung\nund Steuerung" ];
                82 [ sortv=2203 label="Anforderungen an Produkte\nund Dienstleistungen" ];
                83 [ sortv=2204 label="Entwicklung von\nProdukten und\nDienstleistungen" ];
                84 [ sortv=2205 label="Steuerung von extern\nbereitgestellten Prozessen,\nProdukten und Dienstleistungen" ];
                85 [ sortv=2206 label="Produktion und\nDienstleistungserbringung" ];
                86 [ sortv=2207 label="Freigabe von Produkten\nund Dienstleistungen" ];
                87 [ sortv=2208 label="Steuerung nichtkonformer\nErgebnisse" ];
            }
        }
        node[ color="#f3e8b8" label="" ];
        subgraph cluster_12 {  sortv=3000 packmode=array_tu1 pack=false label=""
            subgraph cluster_13 {  sortv=3100 pack=false label=""
                heading_check [ height=0.55 fontsize = 27 label=<<B>Check</B>> ];
            }
            subgraph cluster_14 {  sortv=3200 packmode=array_tu1 pack=20 label=""
                90 [ sortv=3201  height=1.1 fontsize = 22 label=<<B>9<BR/>Bewertung der Leistung</B>> ];
                91 [ sortv=3202 label="Überwachung, Messung,\nAnalyse und Bewertung" ];
                92 [ sortv=3203 label="Internes\nAudit" ];
                93 [ sortv=3204 label="Management-\nbewertung" ];
            }
        }
        node[ color="#dad5ea" label="" ];
        subgraph cluster_15 {  sortv=4000 packmode=array_tu1 pack=false label=""
            subgraph cluster_16 {  sortv=4100 pack=false label=""
                heading_act [ height=0.55 fontsize = 27 label=<<B>Act</B>> ];
            }
            subgraph cluster_17 {  sortv=4200 packmode=array_tu1 pack=20 label=""
                100 [ sortv=4201  height=1.1 fontsize = 22 label=<<B>10<BR/>Verbesserung</B>> ];
                101 [ sortv=4202 label="Nichtkonformität und\nKorrekturmaßnahmen" ];
                102 [ sortv=4203 label="Fortlaufende\nVerbesserung" ];
            }
        }
    }
}

I was going to make the same suggestion as @steveroush made above, to use HTML-like labels.

You are already using HTML-like labels for your bold headings such as <<B>Plan</B>>. You can try creating a HTML table consisting of one row, and one cell and then use the table height and width attributes to control the spacing.

Thank you both - You were a great help!

I tend to be a perfectionist, so I will spare your fine tuning tips for this label for a later diagram. It already looks great and I have some more to draw …