can we place horizontal and vertical direction with edge length in a directed graph using grapviz ?

- You can create images like the above, if you are willing/able to position/locate the nodes yourself
- However, I don’t believe that any of the Graphviz engines will produce a graph anywhere close to the above “on their own” (without lots of user guidance)
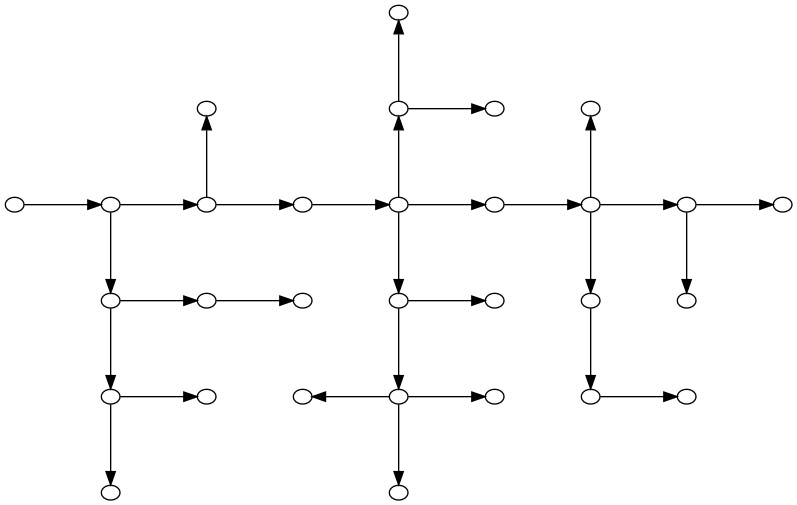
Here is a Graphviz file that can be fed to neato (not dot) to produce a copy of your graph. Note the use of the pin and pos attributes
 digraph HV {
  splines=false
  node [label="" width=.2 height=.15 pin=true]
   "n3,4" [pos="4,3"]
   "n5,7" [pos="7,5"]
   "n3,5" [pos="5,3"]
   "n1,2" [pos="2,1"]
   "n3,6" [pos="6,3"]
   "n4,1" [pos="1,4"]
   "n6,5" [pos="5,6"]
   "n3,7" [pos="7,3"]
   "n4,2" [pos="2,4"]
   "n3,8" [pos="8,3"]
   "n1,5" [pos="5,1"]
   "n4,3" [pos="3,4"]
   "n4,4" [pos="4,4"]
   "n4,5" [pos="5,4"]
   "n2,2" [pos="2,2"]
   "n2,3" [pos="3,2"]
   "n4,6" [pos="6,4"]
   "n2,4" [pos="4,2"]
   "n4,7" [pos="7,4"]
   "n2,5" [pos="5,2"]
   "n5,3" [pos="3,5"]
   "n4,8" [pos="8,4"]
   "n2,6" [pos="6,2"]
   "n4,9" [pos="9,4"]
   "n2,7" [pos="7,2"]
   "n5,5" [pos="5,5"]
   "n3,2" [pos="2,3"]
   "n2,8" [pos="8,2"]
   "n3,3" [pos="3,3"]
   "n5,6" [pos="6,5"]
   "n2,2" -> "n1,2"
   "n3,2" -> "n2,2"
   "n4,2" -> "n3,2"
   "n4,1" -> "n4,2"
   "n4,2" -> "n4,3"
   "n4,3" -> "n4,4"
   "n4,4" -> "n4,5"
   "n4,5" -> "n4,6"
   "n4,6" -> "n4,7"
   "n4,7" -> "n4,8"
   "n4,8" -> "n4,9"
   "n5,5" -> "n5,6"
   "n4,5" -> "n5,5"
   "n4,3" -> "n5,3"
   "n4,7" -> "n5,7"
   "n2,2" -> "n2,3"
   "n3,2" -> "n3,3"
   "n3,3" -> "n3,4"
   "n2,5" -> "n2,4"
   "n2,5" -> "n1,5"
   "n2,5" -> "n2,6"
   "n3,5" -> "n3,6"
   "n3,7" -> "n2,7"
   "n4,7" -> "n3,7"
   "n4,8" -> "n3,8"
   "n2,7" -> "n2,8"
   "n5,5" -> "n6,5"
   "n4,5" -> "n3,5"
   "n3,5" -> "n2,5"
}
Giving:
ok thanks for your comment
Just because I was curious, I applied some of the Graphviz engines to the above input file with pin=false.
dot - oh look, it is a tree. (I had not recognized that)

fdp - surprisingly close to the desired horizontal/vertical layout, but a challenge to programmatically do the transform

neato (without pinning) - very similar to fdp
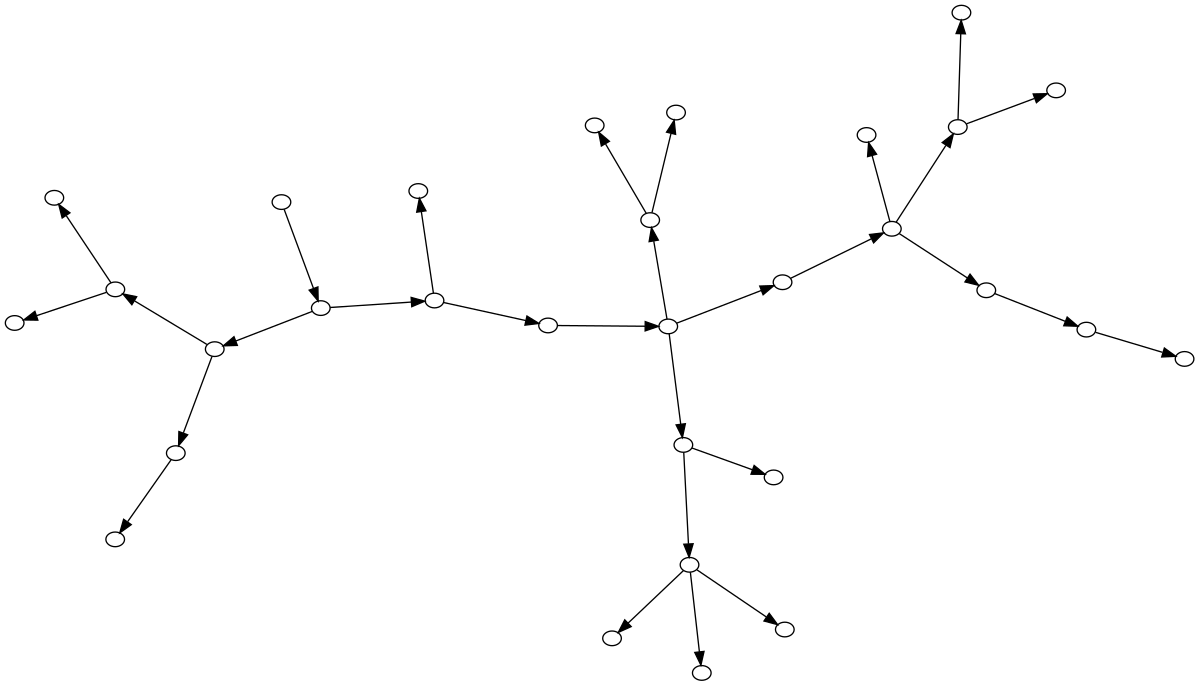
So, could one come up with an algorithm to produce the desired graph (or equivalent) without having positions provided by the user?
You can create grid with some visible and some invisible edges.

graph grid
{
	fontname="Helvetica,Arial,sans-serif"
	node [fontname="Helvetica,Arial,sans-serif"]
	edge [fontname="Helvetica,Arial,sans-serif"]
	layout=dot
	label="grid"
	labelloc = "t"
	node [shape=plaintext]
	// arbitrary path on rigid grid
	A0 -- B1 -- C2 -- D3 -- E4 -- F5 -- G6 -- H7
	H0 -- G1 -- F2 -- E3 -- D4 -- C5 -- B6 -- A7

	edge [weight=1000 style=dashed color=dimgrey]

	// uncomment to hide the grid
	//edge [style=invis]

	A0 -- A1 -- A2 -- A3 -- A4 -- A5 -- A6 -- A7
	B0 -- B1 -- B2 -- B3 -- B4 -- B5 -- B6 -- B7
	C0 -- C1 -- C2 -- C3 -- C4 -- C5 -- C6 -- C7
	D0 -- D1 -- D2 -- D3 -- D4 -- D5 -- D6 -- D7
	E0 -- E1 -- E2 -- E3 -- E4 -- E5 -- E6 -- E7
	F0 -- F1 -- F2 -- F3 -- F4 -- F5 -- F6 -- F7
	G0 -- G1 -- G2 -- G3 -- G4 -- G5 -- G6 -- G7
	H0 -- H1 -- H2 -- H3 -- H4 -- H5 -- H6 -- H7

	rank=same {A0 -- B0 -- C0 -- D0 -- E0 -- F0 -- G0 -- H0}
	rank=same {A1 -- B1 -- C1 -- D1 -- E1 -- F1 -- G1 -- H1}
	rank=same {A2 -- B2 -- C2 -- D2 -- E2 -- F2 -- G2 -- H2}
	rank=same {A3 -- B3 -- C3 -- D3 -- E3 -- F3 -- G3 -- H3}
	rank=same {A4 -- B4 -- C4 -- D4 -- E4 -- F4 -- G4 -- H4}
	rank=same {A5 -- B5 -- C5 -- D5 -- E5 -- F5 -- G5 -- H5}
	rank=same {A6 -- B6 -- C6 -- D6 -- E6 -- F6 -- G6 -- H6}
	rank=same {A7 -- B7 -- C7 -- D7 -- E7 -- F7 -- G7 -- H7}
}
// grid.dot by Costa Shulyupin