Steve, I have a suspicion you are the only person on the planet who understands Graphviz phases. If you have time to write a description, I’ll happily commit it. If you don’t have time, no worries.
(@smattr’s comment made me laugh)
Pretty sure others know much more about dot’s phases, but I’ll give it a shot.
I believe I can conclude this thread for the time being, as I consider the immediate performance problems to be resolved through the suggestions I received here. I want to do a follow-up in the Show & Tell section to share more of the results.
In the course of working with the suggestions, I had to build a lot of graphs. Trying any suggestion on a single graph was rarely enough to fully evaluate it. So I wrote an extensive Makefile to incrementally work through the different render stages and variations. Maybe someone has use for it for their own future work ![]() I also found that
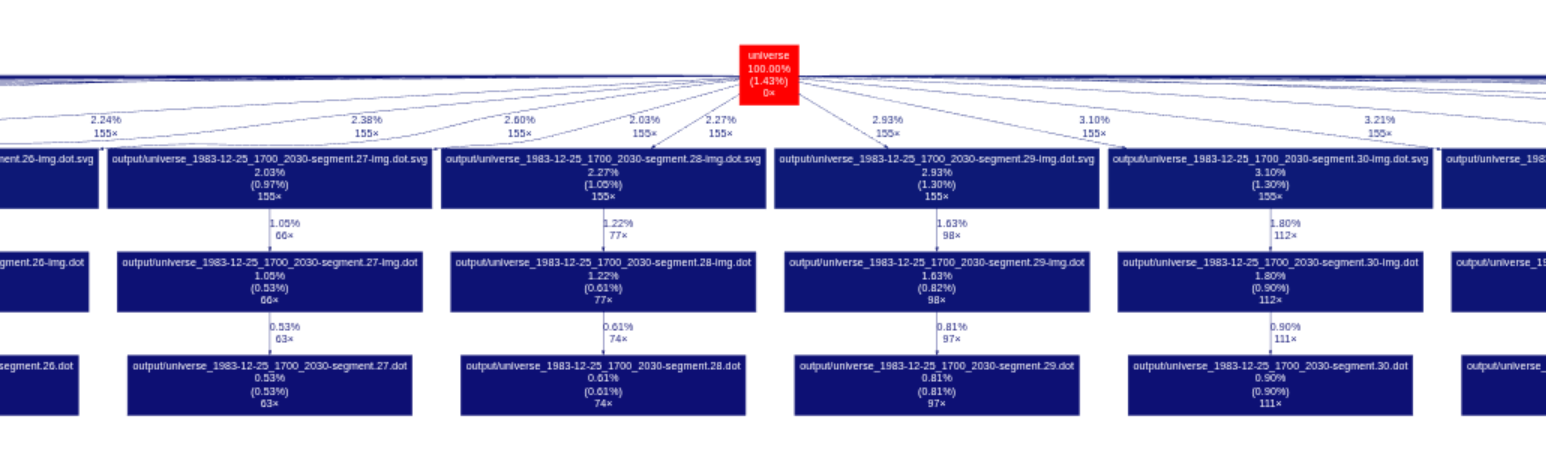
I also found that remake can generate a callgrind performance profile of the build, which you can then convert to DOT format to see a graph of your build of your graph ![]()
I was not able to produce anything useful from the individual dot phases. Maybe my understanding is still not good enough to wield the tools properly, but I felt like I’m just randomly pulling levers.
With the stitching idea, I could quickly see that it had potential to scale linearly, and horizontally, which is always intriguing. I had to rewrite the entire renderer to be able to produce segments. And that’s where the fun started.
It seemed clear to me, that I will want to place invisible nodes at the top and bottom edge for splines to connect to the next segment. So the renderer has to understand which timelines continue into the next segment, place the required guide nodes, and then connect the splines to those “transfer nodes”. Even before I started implementing this, I realized that I have no idea how to control the X-order of the transfer nodes, but I figured I’ll solve that later (famous last words).
First results of rendered segments looked like this could work, when I messed with the SVG in Inkscape.

I then realized that you can run edges between all transfer nodes in a subgraph, which will force them into a defined X-order. What a rush! Now they just need some fixedsize and width to force all transfer nodes to be in defined X-order, and at defined X-offsets, and suddenly all the transfer nodes have consistent and reliable positions. Connect to the North and South ports on the transfer nodes to align the spline endings… and the segments match up “perfectly” in Inkscape.

Through class and id magic, I force enough metadata into the SVG to find the transfer markers with my regex-based SVG stitcher ![]() It runs through all segments to calculate the actual bounding boxes of the content as I require it for stitching, and it find the leftmost transfer node XY coordinates. Then it makes another pass to write the root segment group from each SVG into a new SVG, with the
It runs through all segments to calculate the actual bounding boxes of the content as I require it for stitching, and it find the leftmost transfer node XY coordinates. Then it makes another pass to write the root segment group from each SVG into a new SVG, with the translate() transform adjusted to move the segment into exactly the spot where the transfer nodes connect. And this actually works well enough. See the screenshots below to see how much work is left to be done.
Now, while this whole entire thread has been going on, there was this thought still in the back of my mind: You probably don’t need to render all those style="invis" edges, and the result will look almost the same.
When I wrote the segmenting code, and it left a lot of transfer nodes for timelines that are not visibly linked, I figured I should now finally remove the code that adds those edges. It’s probably more obvious to some of you that this has a dramatic impact on performance. Even with that free performance boost, the work was still necessary though, as I’m now closing in on 10,000 event nodes in the full graph.
I’m currently segmenting at ~300 timestamps (ranks), which is not ideal for build performance, but reduces stitches. My fastest builds so far have been with segments of ~100 ranks. When I fully saturate this workstation with 24 build processes, the source segments are generated, canonicalized, mutated with additional transforms (image embedding), rendered to SVG, and then the SVG are stitched into a single document, in 20 seconds.
The resulting SVG is ~11 MB in size (6.6 MB with scour optimization) and it has a bounding box of 6,000 x 670,000 points.
The SVG is then embedded directly into an HTML file, and navigation is enabled with a bit of JavaScript that makes sense of id and class values in the SVG. And browsers are handling this surprisingly well so far.
For the time being, I want to leave you with a few impressions of the rendering as-is today. I definitely want to improve the splines, maybe with additional guide nodes, but not right now.

I also finally wrote an anonymizer to be able to share more complete views of the graph.

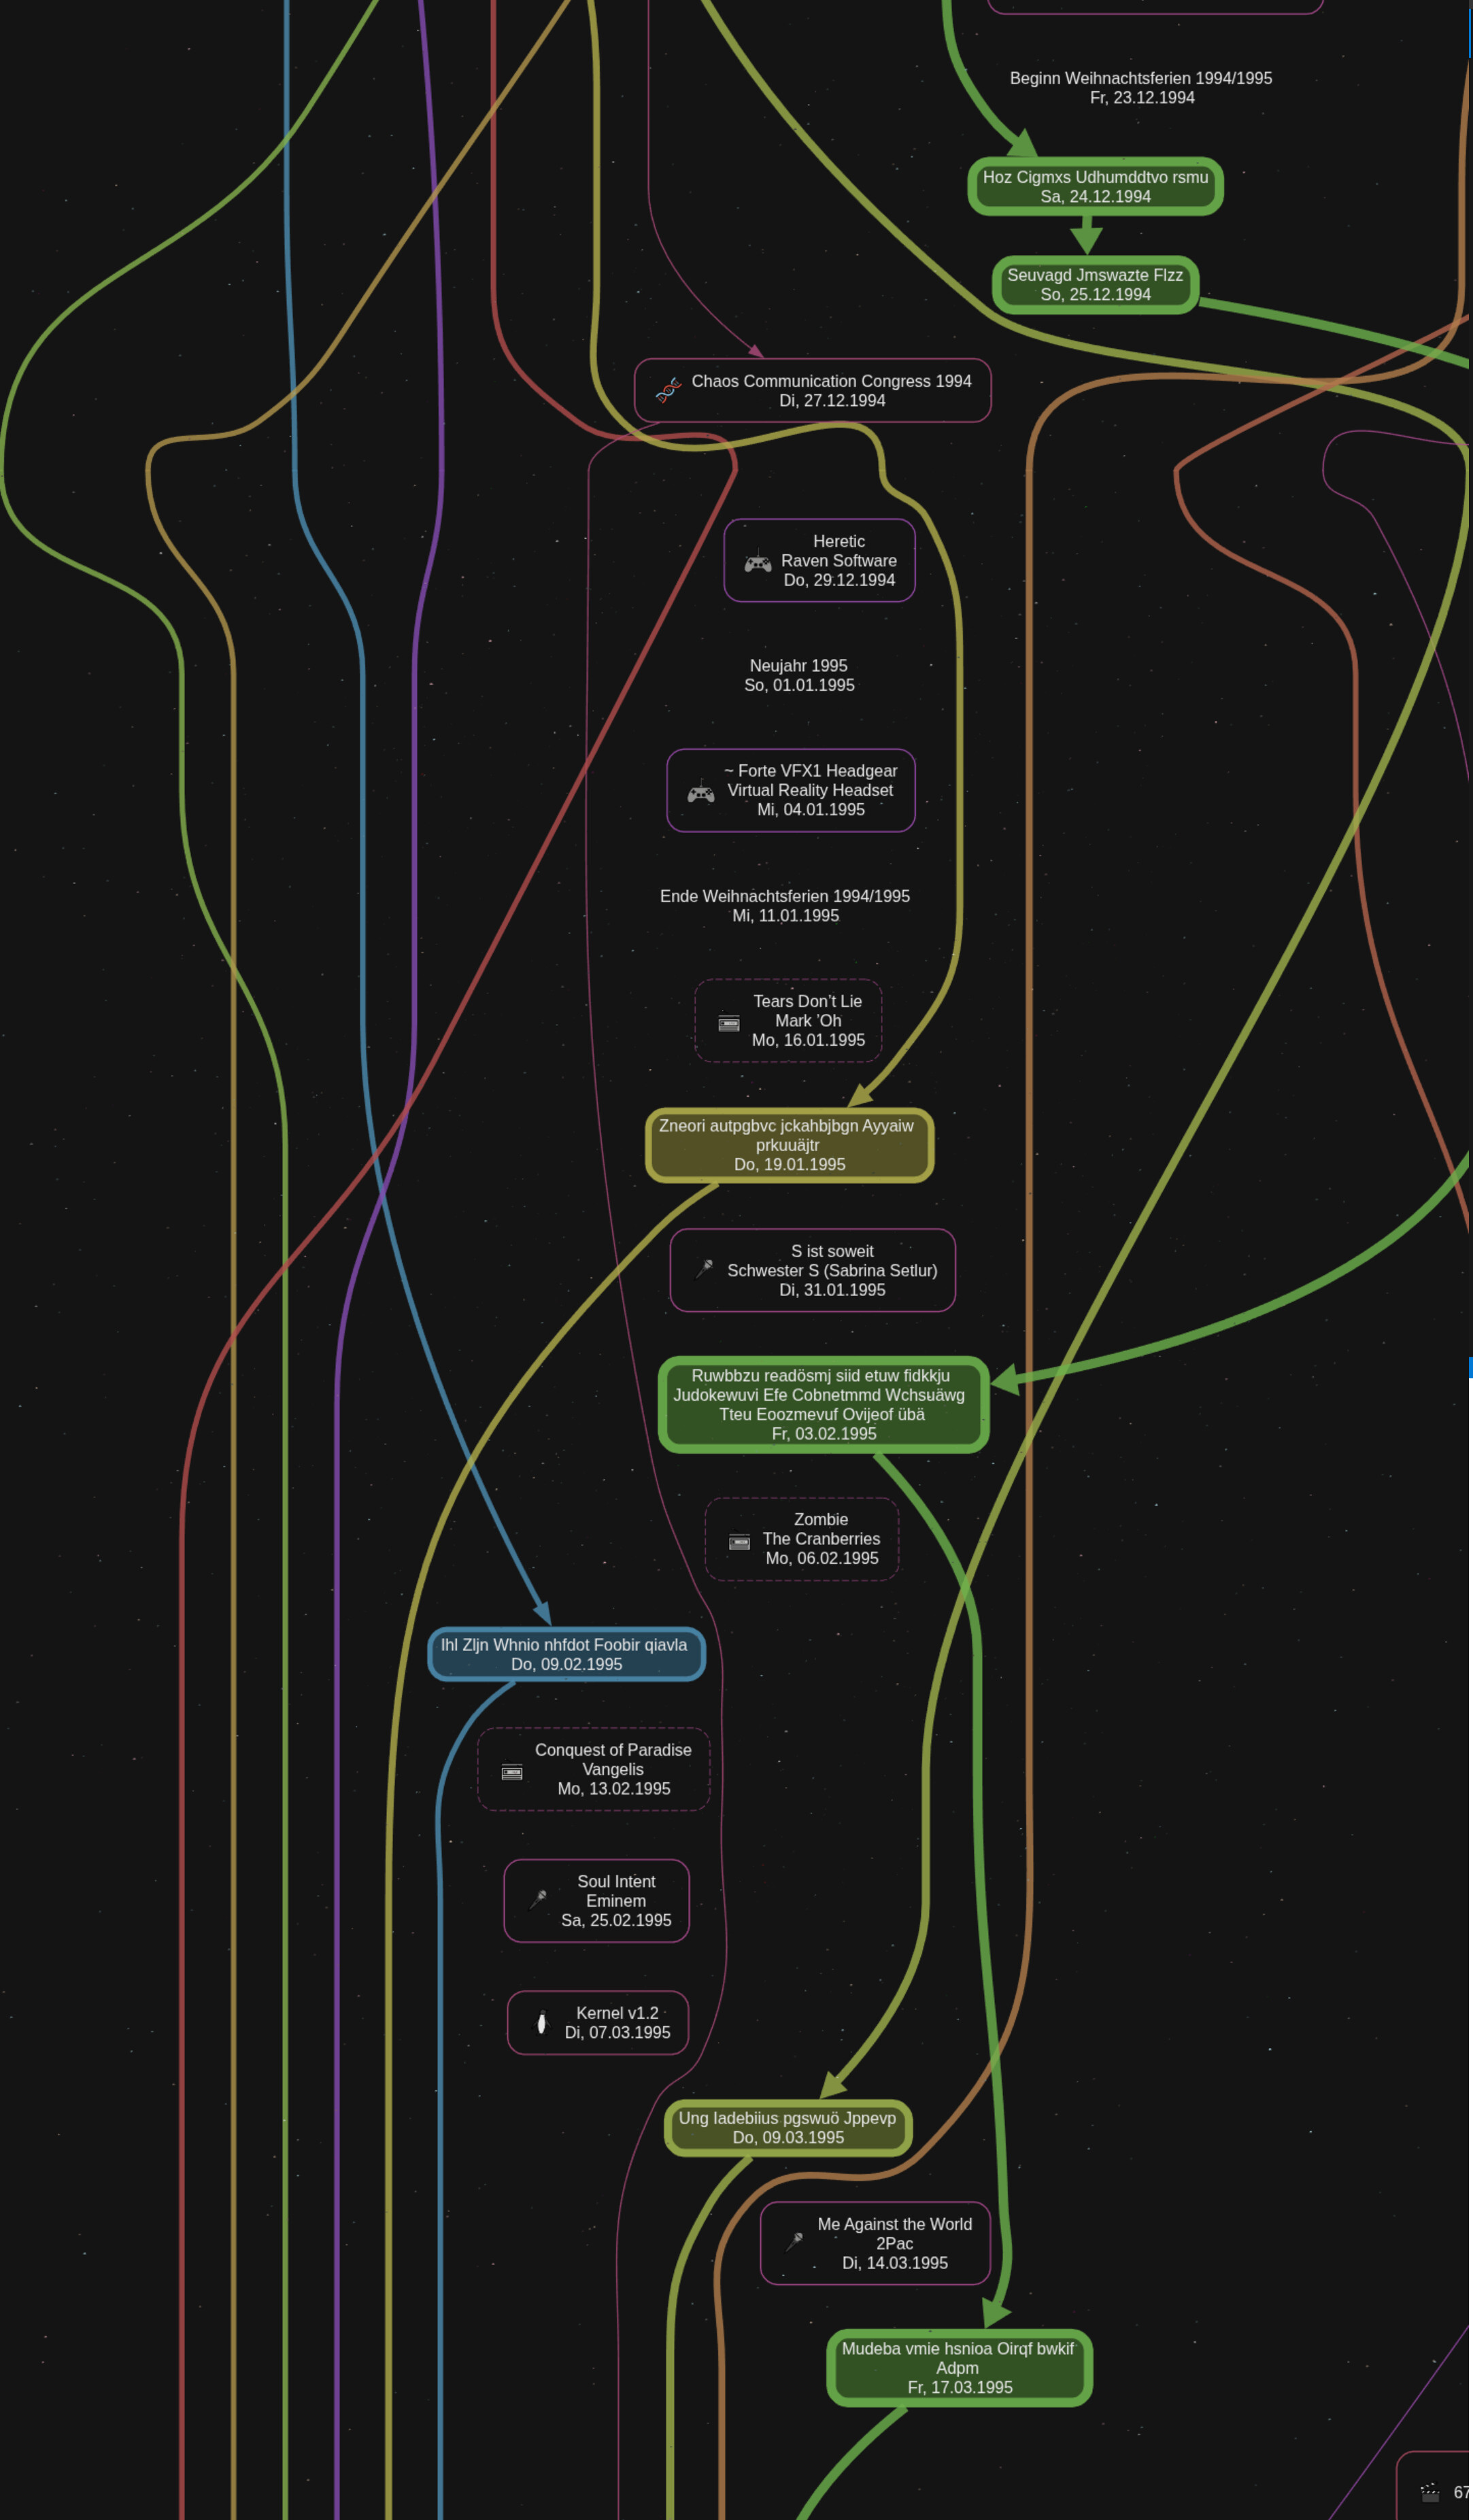
This area has no stitches, but it should give an impression of the overall aesthetic I’m aiming for. The white dashed rectangle supports the keyboard navigation.

Here are some examples of obvious stitching problems, but they (hopefully) also show the beauty of the overall graph.


Thanks again for the continued and valuable support! ![]()
2 Likes
I’ve kept working on this project, and have continuously expanded the scale of the data set, and the associated rendering solution.
My development data set contains >25.000 events, that directly translate into nodes in the graph. The amount of edges is unclear, but they have mostly been the focus of my optimizations.
My biggest misunderstanding was the behavior of edges with style=invis. It’s important to understand that this is really only the style, the visual representation on the screen. The behavior of the edge remains entirely intact. Even if it is not visible, it will still interact with all nodes and edges when solving the graph. For example:

This is a section of one of my “problem solving graph sketches”. The solid edges are the ones that are also visible in the rendering. The dotted edges would be style=invis in my final rendering. They only exist to direct all nodes to their correct rank.
In my rendering approach, I would choose to prefer to draw an excess amount of these “ranking edges”, instead of missing one. The result is that the black edge from _0 to A0 bends around the invisible edge (shown in red).
First of all, this is not aesthetically pleasing. But, more importantly, with edges that run for miles before connecting again, the rendering performance impact is dramatic.
I rewrote my entire renderer a few times, until I was able to eliminate all of these redundant edges. This turned out to be a lot more challenging than anticipated. It looks so obvious and easy to solve, when you look at it visually, but a generic solution that links up all nodes invisibly, when they are not linked otherwise, was incredibly challenging. Here is another screenshot showing a debug view of different edge types in use:

Even with all the redundant edges eliminated, the data set would grow so large that this is not enough.
Another core part of the rendering solution is to be able to link/unlink a single timeline dynamically. Previously, a single timeline could either be linked or not. Usually, it would be people close to me who have a linked timeline. Random data point timelines are usually not linked. But when you have hundreds of people in the system, there are hundreds of edges running through the full graph for the full life time of that person. The cluttering looks horrible, and the rendering performance is poor.
Now, when a timeline has no relevant entries during a period, like when it purely contains the birthdays of that person, the timeline is not linked. This looks much better, and renders blazing fast.
Another feature I was able to add to the renderer recently, is the “correct” layouting of events on the same days, and the links connecting them.

We can see all the edges arriving into the left node, running over into the node on the right, before going down to the next day. Some arrows disappear, as participants split of, or their links are hidden.
Here are some recent metrics:
Universe has 27354 individual entries from 1233 timeline documents.
Universe Horizon
Sun, 16 Jan 1707 00:00:00 GMT - Wed, 05 Mar 2110 00:00:00 GMT
After concatenation, the final SVG is 1,637,391 pt high. The final HTML output document is 26 MB in size. With clean caches, it builds in ~20 seconds.
2 Likes