So, I have a number of unconnected graphs of the form L1→N1→N2; L2→N3; … where each N node have one entry and maybe one exit edge. As the number of nodes grow the vast majority of them are of the form La→Nb;
Associated with each N node is a time value, but the times does not necessarily follow the order of the nodes so in order to model this I add a T node for each timepoint and uses
{ rank=same; Ta Nb } to connect them
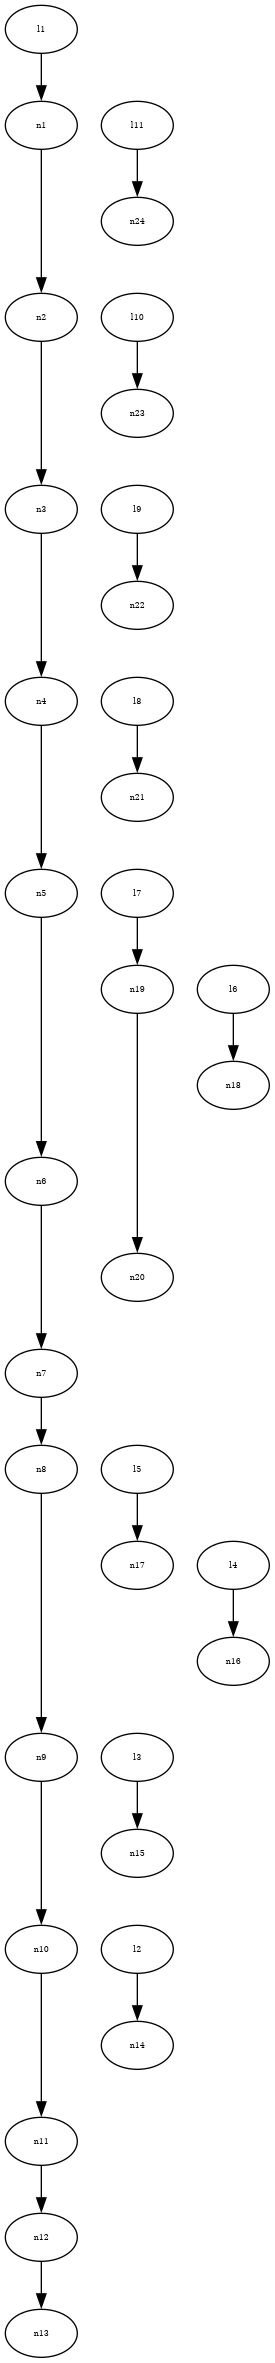
When the number of graphs grows the time to render the graph grows exponentially so for a simple case like this:
[dot]digraph C {
node [fontsize=6];
“l1” → “n1” [weight=1000];
“n1” → “n2” [weight=1000];
“n2” → “n3” [weight=1000];
“n3” → “n4” [weight=1000];
“n4” → “n5” [weight=1000];
“n5” → “n6” [weight=1000];
“n6” → “n7” [weight=1000];
“n7” → “n8” [weight=1000];
“n8” → “n9” [weight=1000];
“n9” → “n10” [weight=1000];
“n10” → “n11” [weight=1000];
“n11” → “n12” [weight=1000];
“n12” → “n13” [weight=1000];
“l2” → “n14” [weight=1000];
“l3” → “n15” [weight=1000];
“l4” → “n16” [weight=1000];
“l5” → “n17” [weight=1000];
“l6” → “n18” [weight=1000];
“l7” → “n19” [weight=1000];
“n19” → “n20” [weight=1000];
“l8” → “n21” [weight=1000];
“l9” → “n22” [weight=1000];
“l10” → “n23” [weight=1000];
“l11” → “n24” [weight=1000];
“t1” [color=red];
{ rank=same; “t1” “n1” }
“t1” → “t2” [color=red]
“t2” [color=red];
{ rank=same; “t2” “n24” }
“t2” → “t3” [color=red]
“t3” [color=red];
{ rank=same; “t3” “n2” }
“t3” → “t4” [color=red]
“t4” [color=red];
{ rank=same; “t4” “n23” }
“t4” → “t5” [color=red]
“t5” [color=red];
{ rank=same; “t5” “n3” }
“t5” → “t6” [color=red]
“t6” [color=red];
{ rank=same; “t6” “n22” }
“t6” → “t7” [color=red]
“t7” [color=red];
{ rank=same; “t7” “n4” }
“t7” → “t8” [color=red]
“t8” [color=red];
{ rank=same; “t8” “n21” }
“t8” → “t9” [color=red]
“t9” [color=red];
{ rank=same; “t9” “n5” }
“t9” → “t10” [color=red]
“t10” [color=red];
{ rank=same; “t10” “n19” }
“t10” → “t11” [color=red]
“t11” [color=red];
{ rank=same; “t11” “n18” }
“t11” → “t12” [color=red]
“t12” [color=red];
{ rank=same; “t12” “n6” }
“t12” → “t13” [color=red]
“t13” [color=red];
{ rank=same; “t13” “n20” }
“t13” → “t14” [color=red]
“t14” [color=red];
{ rank=same; “t14” “n7” }
“t14” → “t15” [color=red]
“t15” [color=red];
{ rank=same; “t15” “n8” }
“t15” → “t16” [color=red]
“t16” [color=red];
{ rank=same; “t16” “n17” }
“t16” → “t17” [color=red]
“t17” [color=red];
{ rank=same; “t17” “n16” }
“t17” → “t18” [color=red]
“t18” [color=red];
{ rank=same; “t18” “n9” }
“t18” → “t19” [color=red]
“t19” [color=red];
{ rank=same; “t19” “n15” }
“t19” → “t20” [color=red]
“t20” [color=red];
{ rank=same; “t20” “n10” }
“t20” → “t21” [color=red]
“t21” [color=red];
{ rank=same; “t21” “n14” }
“t21” → “t22” [color=red]
“t22” [color=red];
{ rank=same; “t22” “n11” }
“t22” → “t23” [color=red]
“t23” [color=red];
{ rank=same; “t23” “n12” }
“t23” → “t24” [color=red]
“t24” [color=red];
{ rank=same; “t24” “n13” }
}[/dot]
I end up with
network simplex: 132 nodes 167 edges 35 iter 0.00 sec
routesplines: 47 edges, 167 boxes 0.00 sec
but it I remove the t nodes and all the rank declarations that falls to
network simplex: 59 nodes 69 edges 11 iter 0.00 sec
routesplines: 24 edges, 72 boxes 0.00 sec
The problem is that when the number of nodes grows so when I have about 50k nodes the render times explode to this horror
network simplex: 500572 nodes 727285 edges 536022 iter 27777.56 sec
routesplines: 47569 edges, 168497 boxes 1.13 sec
so I was wondering if there is something I can do to make the work easier for dot?