
Is there a way to add node as common between two clusters ? Sample is given in the attached diagram.
If blue is one cluster and brown is another one. I am looking to have node C and D common to both clusters.
Short answer: No, sorry. None of the engines supports overlapping clusters.
More info answer: see this chain of related questions and answers Subset Diagrams
With a bit of work answer (if you want some more challenge in your life):
The result of roughly an hour of fiddling:
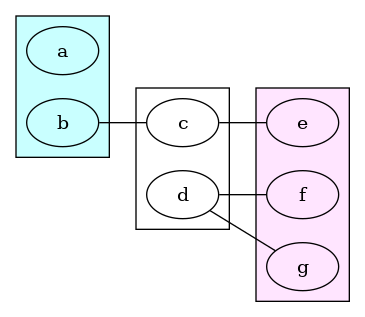
First, the starting place - using 3 clusters:
graph V{
  rankdir=LR
  subgraph cluster1{
    graph [style=filled fillcolor="#a0ffff90"]
    a
    b
  }
  subgraph cluster2{
  c d
  }
  subgraph cluster3{
    graph [style=filled fillcolor="#ffbbff60"];
    e f g
  }
  b -- c -- e
  d -- f
  d --g
}
Giving:
Then dot myfile.gv > myfile.dot - produces input plus positioning of all nodes, edges & clusters.
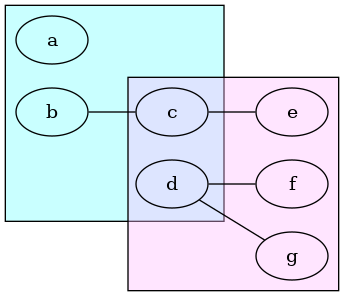
Finally, I hand-edited the file (fifteen time or so) to remove the 2nd cluster, move those nodes into the 1st cluster, and resized the bb (bounding boxes) of the two remaining clusters, producing this:
graph V {
	graph [bb="0,0,266,230",
		rankdir=LR
	];
	node [label="\N"];
	subgraph cluster1 {
		graph [OLDbb="8,116,78,222"
		      bb="8,60,172,222" style=filled fillcolor="#a0ffff90"];
		a	[height=0.5,
			pos="43,196",
			width=0.75];
		b	[height=0.5,
			pos="43,142",
			width=0.75];

		c	[height=0.5,
			pos="133,142",
			width=0.75];
		d	[height=0.5,
			pos="133,88",
			width=0.75];
	}
	subgraph cluster3 {
		graph [OLDbb="188,8,258,168"
			bb="100,8,258,168" style=filled fillcolor="#ffbbff60"];
		e	[height=0.5,
			pos="223,142",
			width=0.75];
		f	[height=0.5,
			pos="223,88",
			width=0.75];
		g	[height=0.5,
			pos="223,34",
			width=0.75];
	}
	b -- c	[pos="70.403,142 81.541,142 94.48,142 105.62,142"];
	c -- e	[pos="160.4,142 171.54,142 184.48,142 195.62,142"];
	d -- f	[pos="160.4,88 171.54,88 184.48,88 195.62,88"];
	d -- g	[pos="153.53,76.016 168.11,67.067 187.95,54.892 202.52,45.951"];
}
Finally to produce a finished graph neato -n2 myfile.dot -Tpng >myfile.png (see FAQ | Graphviz)