I don’t think it is a bug, it seems to be a limitation of the pin2pin script. multi-color edges seem to require four distinct points, and it chops them down too far.
I took this graph, which has a loopy edge:
graph {
// Graph generated by WireViz 0.4
// https://github.com/formatc1702/WireViz
graph [bgcolor="#FFFFFF" fontname=arial nodesep=0.33 rankdir=LR ranksep=2]
node [fillcolor="#FFFFFF" fontname=arial height=0 margin=0 shape=none style=filled width=0]
edge [fontname=arial penwidth=2]
edge [color="#000000:#ffffff:#000000"]
X1:p5r:e -- W1:w1:w
W1:w1:w -- W1:w1:e [straight=straight]
W1:w1:e -- X2:p1l:w
W1 [label=<
<table border="0" cellspacing="0" cellpadding="0">
<tr><td>
<table border="0" cellspacing="0" cellpadding="3" cellborder="1"><tr>
<td balign="left">W1</td>
</tr></table>
</td></tr>
<tr><td>
<table border="0" cellspacing="0" cellpadding="3" cellborder="1"><tr>
<td balign="left">3x</td>
<td balign="left">0.25 mm²</td>
<td balign="left">+ S</td>
<td balign="left">0.2 m</td>
</tr></table>
</td></tr>
<tr><td>
<table border="0" cellspacing="0" cellborder="0">
<tr><td> </td></tr>
<tr>
<td>X1:5:GND</td>
<td>
1:WH
</td>
<td>X2:1:GND</td>
</tr>
<tr>
<td colspan="3" port="w1" height="6"> </td>
</tr>
</table>
</td></tr>
</table>
> fillcolor="#FFFFFF" shape=box style=filled]
}
…And ran it through pin2pin, which changed the loopy edge like so:
W1:w1:w -- W1:w1:e      [
oldpos="160.5,9.25 96.938,34.667 96.938,128.5 262.5,128.5 428.06,128.5 428.06,34.667 364.5,9.25",
pos="160.5,9.25 160.5,9.25 364.5,9.25 364.5,9.25",
straight=straight];
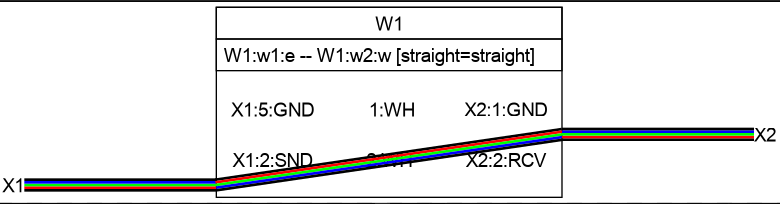
That renders like this:

So then I went in and just hand-edited the pos value to this:
pos="160.5,9.23 220,9.25 300,9.25 364.5,9.25",
(arbitrarily picking values between 160.5 and 364.5 for the x coordinates), and voila:

How is it with 4 or 5 colors, or does graphviz wants a rectangle to fill it.

If I want to do math on values with gvpr, how do I do that if they’re strings? Do I have to use sscanf() to convert them to doubles, first? And then sprintf() to convert them back to strings?
I tried this, but the code came out with pos=15:
  p1=tok[0];
  p2=tok[cnt-1];
  pos=p1 + " "
    + xOf(p1) + (xOf(p2)-xOf(p1)/3) + ","
    + yOf(p1) + (yOf(p2)-yOf(p1)/3) + " "
    + xOf(p1) + 2*(xOf(p2)-xOf(p1)/3) + ","
    + yOf(p1) + 2*(yOf(p2)-yOf(p1)/3) + " "
    + p2;
(Ignore that my closing parens are on the wrong side of /3.)
Ah, got it! A pin2pin that works on multi-color edges:
/*******************************************************************

  see https://forum.graphviz.org/t/straitening-one-line-throu-a-table/2196
  input must include pos values (must be output from one of the engines w/ -Tdot)

*******************************************************************/
BEG_G{
  double x1,y1,x2,y2,x3,y3,x4,y4;
  string tok[int];
  int cnt;

/***************************************
  $G.bb="";
  $G.nodesep="";
  $G.ranksep="";
  $G.splines="true";
****************************************/
}
/********************************************************
  the weakness is in the head==tail test
  it would be better to mark every target edge with a new attribute and test for that attribute
*********************************************************/
E[$.head==$.tail] {
  cnt=tokens($.pos,tok," ");
  $.oldpos=$.pos;
  x1 = xOf(tok[0]);
  y1 = yOf(tok[0]);
  x4 = xOf(tok[cnt-1]);
  y4 = yOf(tok[cnt-1]);
  x2 = x1 + (x4-x1)/3.;
  y2 = y1 + (y4-y1)/3.;
  x3 = x1 + 2.*(x4-x1)/3.;
  y3 = y1 + 2.*(y4-y1)/3.;
  pos=sprintf("%.3f,%.3f %.3f,%.3f %.3f,%.3f %.3f,%.3f", x1,y1, x2,y2, x3,y3, x4,y4);
  $.label="";  // remove pesky label
  $.lp="";      // remove peskier label pos
}
Example output of the pipeline, no hand-editing:

Cool Thx
(Probably a good idea to close this, now.)
Nice
I have discovered one caveat to this: With multicolor (non-symmetrical) edges, it matters which direction the edge is drawn.
If I change my last graph source above like so:
--- wirelayout.gv	2024-06-21 00:22:21.090601779 -0400
+++ wirelayout_swapped.gv	2024-06-21 00:22:04.962276010 -0400
@@ -6,7 +6,7 @@
 	edge [fontname=arial penwidth=2]
 	edge [color="#000000:red:green:blue:#000000"]
 	X1:p5r:e -- W1:w1:w
-	W1:w1:w -- W1:w1:e [straight=straight]
+	W1:w1:e -- W1:w1:w [straight=straight]
 	W1:w1:e -- X2:p1l:w
 	W1 [label=<
 <table border="0" cellspacing="0" cellpadding="0">
(In other words, reverse the direction of the multicolor edge), running it thru the pipeline with my pin2pin, produces this!

Of course, if the edge colors are symmetrical it wouldn’t matter, because the output would be the same regardless.
There’s probably some sort of logic that could be added to pin2pin, to correct for this. Swap x1,y1 and x4,y4 if the coordinates of the second are lower than the coordinates of the first, perhaps.
How that should be handled with diagonal edges, if (say) x1 < x4 but y4 < y1, I couldn’t begin to guess and would probably have to experiment. (I haven’t even tried pin2pin on diagonals at all. I just know it would work, because it interpolates both x and y separately, and there’s no reason they couldn’t both vary.)
It might be that only the x coordinate ordering matters? Or, y coordinate ordering only matters if x1 == x4.
For my implementation I have controll over it and can say that it is always West to East.
But yes a solution in the pin2pin would be better.
@FeRDNYC could you try drawing two Vertical lines, one from top to bottom amd one the other way around?
Maybe then also two at a random angle?
This is to see how the colors are put next to each other.
I did diagonals, sloping up and down, and in all cases drawing the line from left-to-right was correct, and drawing from right-to-left resulted in upside-down colors.
(The edge definition is in the second table row of these images.)


Fully vertical is trickier, n and s attachments in these tables will look weird and not be very clear. I’ll try to set one up eventually, but it might take a bit. If you can provide the basic graph structure, I’ll generate the permutations from it.
Also, in all of these diagonals the edge on each side of the straightened one is drawn from left-to-right. If those edges were drawn in reverse, then it would be correct to reverse the straightened one as well.
(But I can’t easily demonstrate that with this graph definition, either, because reversing the edges moves the nodes around and screws up the layout. Again, feel free to supply a graph definition with right-to-left multicolor edges and I’ll run it through the code.)
Could you just go from the Top East to the Bottom East?
Also you can use this for the vertical:
graph {
// Graph generated by WireViz 0.5-dev
// https://github.com/formatc1702/WireViz
	graph [bgcolor="#FFFFFF" fontname=arial nodesep=0.33 rankdir=LR ranksep=2]
	node [fillcolor="#FFFFFF" fontname=arial height=0 margin=0 shape=none style=filled width=0]
	edge [fontname=arial style=bold]
	edge [color="#FF66CC" headclip=false style="solid,bold" tailclip=false]
	X1:p1j:c -- X1:p5j:c [addPTS=.18 colorPTS="#FF66CC" straight=straight]
	X1:p5j:c -- X1:p7j:c [addPTS=.18 colorPTS="#FF66CC" straight=straight]
	edge [color="#FF0000" headclip=false style="solid,bold" tailclip=false]
	X1:p2j:c -- X1:p6j:c [addPTS=.18 colorPTS="#FF0000" straight=straight]
	edge [headclip=true style=bold tailclip=true]
	X1 [label=<
<table border="0" cellspacing="0" cellpadding="0">
 <tr><td>
  <table border="0" cellspacing="0" cellpadding="3" cellborder="1"><tr>
   <td balign="left">X1</td>
  </tr></table>
 </td></tr>
 <tr><td>
  <table border="0" cellspacing="0" cellpadding="3" cellborder="1"><tr>
   <td balign="left">Molex KK 254</td>
   <td balign="left">female</td>
   <td balign="left">7-pin</td>
  </tr></table>
 </td></tr>
 <tr><td>
  <table border="0" cellspacing="0" cellpadding="3" cellborder="1">
   <tr>
    <td></td>
    <td>SH1</td>
    <td>SH2</td>
    <td></td>
   </tr>
   <tr>
    <td>GND</td>
    <td width="21" port="p1J"></td>
    <td></td>
    <td port="p1r">1</td>
   </tr>
   <tr>
    <td>VCC</td>
    <td></td>
    <td width="21" port="p2J"></td>
    <td port="p2r">2</td>
   </tr>
   <tr>
    <td>RX</td>
    <td></td>
    <td></td>
    <td port="p3r">3</td>
   </tr>
   <tr>
    <td>TX</td>
    <td></td>
    <td></td>
    <td port="p4r">4</td>
   </tr>
   <tr>
    <td>GND</td>
    <td width="21" port="p5J"></td>
    <td></td>
    <td port="p5r">5</td>
   </tr>
   <tr>
    <td>VCC</td>
    <td></td>
    <td width="21" port="p6J"></td>
    <td port="p6r">6</td>
   </tr>
   <tr>
    <td>GND</td>
    <td width="21" port="p7J"></td>
    <td></td>
    <td port="p7r">7</td>
   </tr>
  </table>
 </td></tr>
 <tr><td>
  <table border="0" cellspacing="0" cellpadding="3" cellborder="1"><tr>
   <td balign="left">Additional components</td>
  </tr></table>
 </td></tr>
 <tr><td>
  <table border="0" cellspacing="0" cellpadding="3" cellborder="1"><tr>
   <td align="left" balign="left">42 mm x SH1 x #3 (shortPartA)</td>
  </tr></table>
 </td></tr>
 <tr><td>
  <table border="0" cellspacing="0" cellpadding="3" cellborder="1"><tr>
   <td align="left" balign="left">1 x SH2 x #4 (shortPartB)</td>
  </tr></table>
 </td></tr>
</table>
> fillcolor="#FFFFFF" shape=box style=filled]
}

graph {
// Graph generated by WireViz 0.5-dev
// https://github.com/formatc1702/WireViz
	graph [bgcolor="#FFFFFF" fontname=arial nodesep=0.33 rankdir=LR ranksep=2]
	node [fillcolor="#FFFFFF" fontname=arial height=0 margin=0 shape=none style=filled width=0]
	edge [fontname=arial style=bold]
	edge [ headclip=false style="solid,bold" tailclip=false]
	X1:p5j:c -- X1:p1j:c [color="#000000:red:green:blue:#000000" straight=straight]
	X1:p5j:c -- X1:p7j:c [color="#000000:red:green:blue:#000000" straight=straight]
	edge [color="#FF0000" headclip=false style="solid,bold" tailclip=false]
	X1:p2j:c -- X1:p6j:c [addPTS=.18 colorPTS="#FF0000" straight=straight]
	edge [headclip=true style=bold tailclip=true]
	X1 [label=<
<table border="0" cellspacing="0" cellpadding="0">
 <tr><td>
  <table border="0" cellspacing="0" cellpadding="3" cellborder="1"><tr>
   <td balign="left">X1</td>
  </tr></table>
 </td></tr>
 <tr><td>
  <table border="0" cellspacing="0" cellpadding="3" cellborder="1"><tr>
   <td balign="left">Molex KK 254</td>
   <td balign="left">female</td>
   <td balign="left">7-pin</td>
  </tr></table>
 </td></tr>
 <tr><td>
  <table border="0" cellspacing="0" cellpadding="3" cellborder="1">
   <tr>
    <td></td>
    <td>SH1</td>
    <td>SH2</td>
    <td></td>
   </tr>
   <tr>
    <td>GND</td>
    <td width="21" port="p1J"></td>
    <td></td>
    <td port="p1r">1</td>
   </tr>
   <tr>
    <td>VCC</td>
    <td></td>
    <td width="21" port="p2J"></td>
    <td port="p2r">2</td>
   </tr>
   <tr>
    <td>RX</td>
    <td></td>
    <td></td>
    <td port="p3r">3</td>
   </tr>
   <tr>
    <td>TX</td>
    <td></td>
    <td></td>
    <td port="p4r">4</td>
   </tr>
   <tr>
    <td>GND</td>
    <td width="21" port="p5J"></td>
    <td></td>
    <td port="p5r">5</td>
   </tr>
   <tr>
    <td>VCC</td>
    <td></td>
    <td width="21" port="p6J"></td>
    <td port="p6r">6</td>
   </tr>
   <tr>
    <td>GND</td>
    <td width="21" port="p7J"></td>
    <td></td>
    <td port="p7r">7</td>
   </tr>
  </table>
 </td></tr>
 <tr><td>
  <table border="0" cellspacing="0" cellpadding="3" cellborder="1"><tr>
   <td balign="left">Additional components</td>
  </tr></table>
 </td></tr>
 <tr><td>
  <table border="0" cellspacing="0" cellpadding="3" cellborder="1"><tr>
   <td align="left" balign="left">42 mm x SH1 x #3 (shortPartA)</td>
  </tr></table>
 </td></tr>
 <tr><td>
  <table border="0" cellspacing="0" cellpadding="3" cellborder="1"><tr>
   <td align="left" balign="left">1 x SH2 x #4 (shortPartB)</td>
  </tr></table>
 </td></tr>
</table>
> fillcolor="#FFFFFF" shape=box style=filled]
}
Upper part is Bottom Top and lower Part is Top Bottom(SH1), split is at GND pin 5

Cool, so that tracks. Asymmetrical multicolor edges have to be drawn in the same direction, vertically and/or horizontally, or their colors will be reversed. Not really that terrible a restriction, as long as it’s known and accounted for when generating graphviz code.
I agree, it really is not a terrible restriction.
And for my case I have controll and it is possible to say that they are always drawn in the same direction.